each graph below shows a relationship between x and y. for each graph, determine whether x and y are…
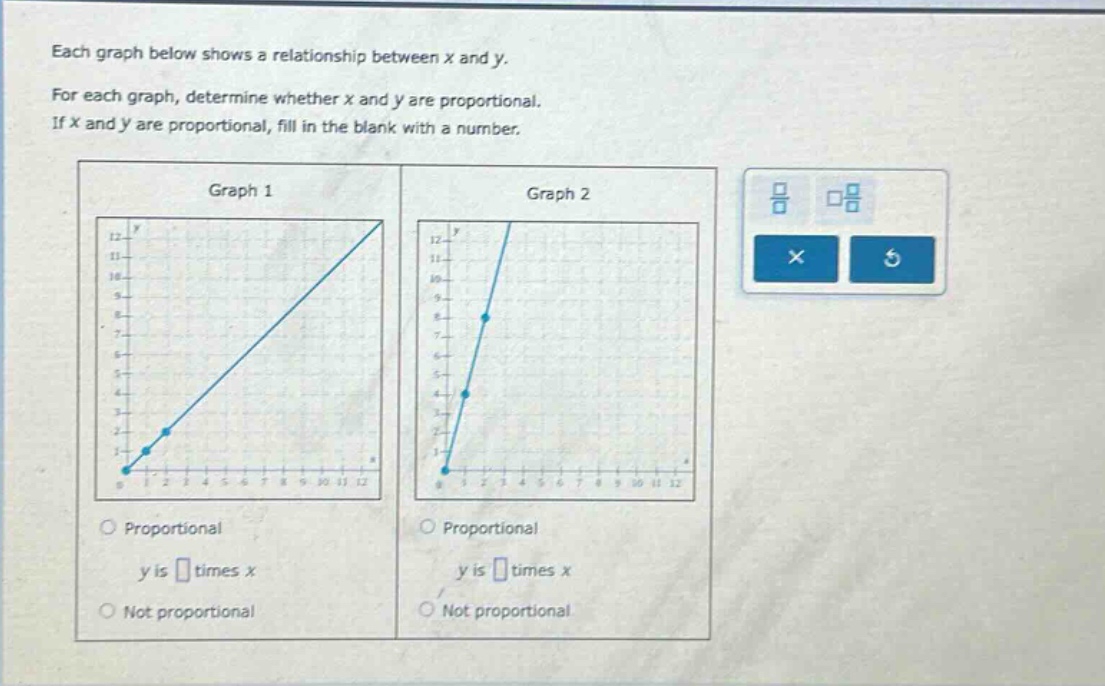
each graph below shows a relationship between x and y. for each graph, determine whether x and y are proportional. if x and y are proportional, fill in the blank with a number. graph 1 graph 2 proportional y is times x proportional y is times x not proportional not proportional
Answer
Explanation:
Step1: Recall proportional - relationship condition
Two variables $x$ and $y$ are proportional if the graph is a straight - line passing through the origin $(0,0)$.
Step2: Analyze Graph 1
The line in Graph 1 passes through the origin $(0,0)$. Let's find the slope $m$ using the formula $m=\frac{y_2 - y_1}{x_2 - x_1}$. Taking two points, say $(0,0)$ and $(1,1)$, then $m=\frac{1 - 0}{1 - 0}=1$. So $y$ is 1 times $x$.
Step3: Analyze Graph 2
The line in Graph 2 does not pass through the origin. So $x$ and $y$ are not proportional.
Answer:
Graph 1: Proportional, $y$ is 1 times $x$ Graph 2: Not proportional