the graph shows the relationship between the number of hours that michelle has been driving and the distance…
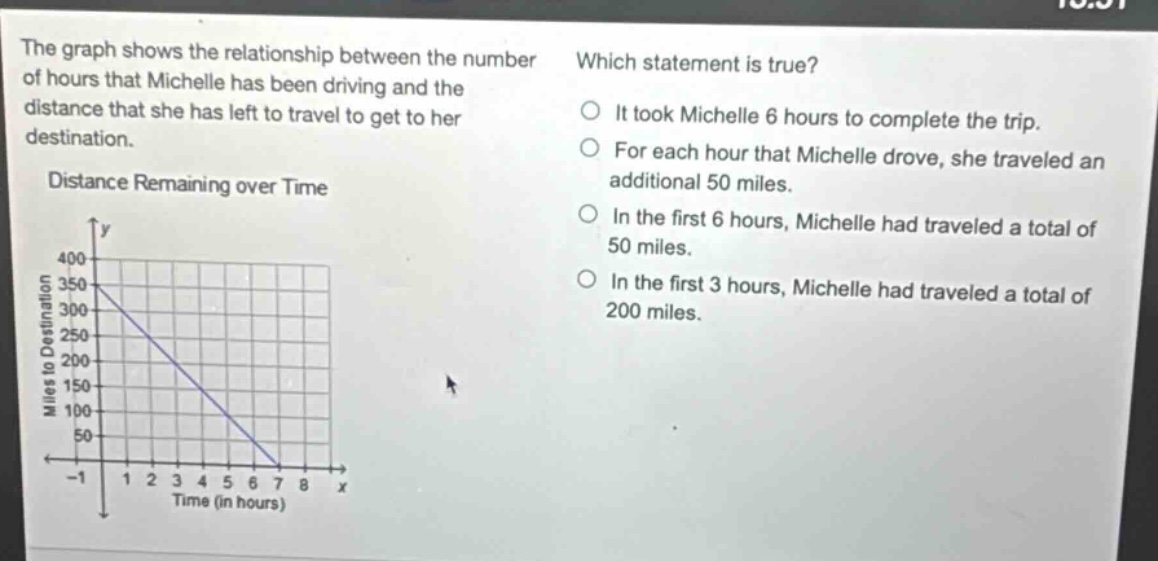
the graph shows the relationship between the number of hours that michelle has been driving and the distance that she has left to travel to get to her destination. distance remaining over time which statement is true? it took michelle 6 hours to complete the trip. for each hour that michelle drove, she traveled an additional 50 miles. in the first 6 hours, michelle had traveled a total of 50 miles. in the first 3 hours, michelle had traveled a total of 200 miles.
Answer
Explanation:
Step1: Analizar la intersección x - eje
La gráfica corta el eje x en x = 7. Esto significa que el viaje se completó en 7 horas, así que la primera opción es falsa.
Step2: Calcular la pendiente
La distancia inicial es de 350 millas y al final (en 7 horas) es de 0 millas. La pendiente $m=\frac{\Delta y}{\Delta x}=\frac{0 - 350}{7-0}=- 50$. Esto significa que por cada hora que conduce, la distancia restante disminuye en 50 millas, es decir, viaja 50 millas por hora.
Step3: Verificar la tercera opción
En 6 horas, la distancia restante es de 50 millas. Entonces, la distancia recorrida es $350 - 50=300$ millas, no 50 millas, así que esta opción es falsa.
Step4: Verificar la cuarta opción
En 3 horas, la distancia restante es de 200 millas. Entonces, la distancia recorrida es $350 - 200 = 150$ millas, no 200 millas, así que esta opción es falsa.
Answer:
For each hour that Michelle drove, she traveled an additional 50 miles.