the graph shows the relationship between pounds of grapes, g, and their cost, c. use the graph to complete…
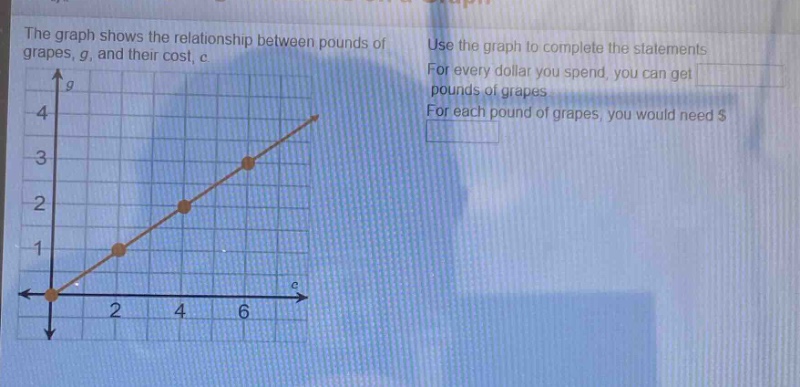
the graph shows the relationship between pounds of grapes, g, and their cost, c. use the graph to complete the statements. for every dollar you spend, you can get pounds of grapes. for each pound of grapes, you would need $
Answer
Explanation:
Step1: Find pounds per dollar.
When ( c = 2 ), ( g = 1 ). Compute ( \frac{g}{c} = \frac{1}{2} = 0.5 ).
Step2: Find cost per pound.
When ( g = 1 ), ( c = 2 ). Compute ( \frac{c}{g} = \frac{2}{1} = 2 ).
Answer:
For every dollar you spend, you can get 0.5 pounds of grapes. For each pound of grapes, you would need $2.