which graph shows the solution to the inequality |x + 3|≥2?
which graph shows the solution to the inequality |x + 3|≥2?
Answer
Answer:
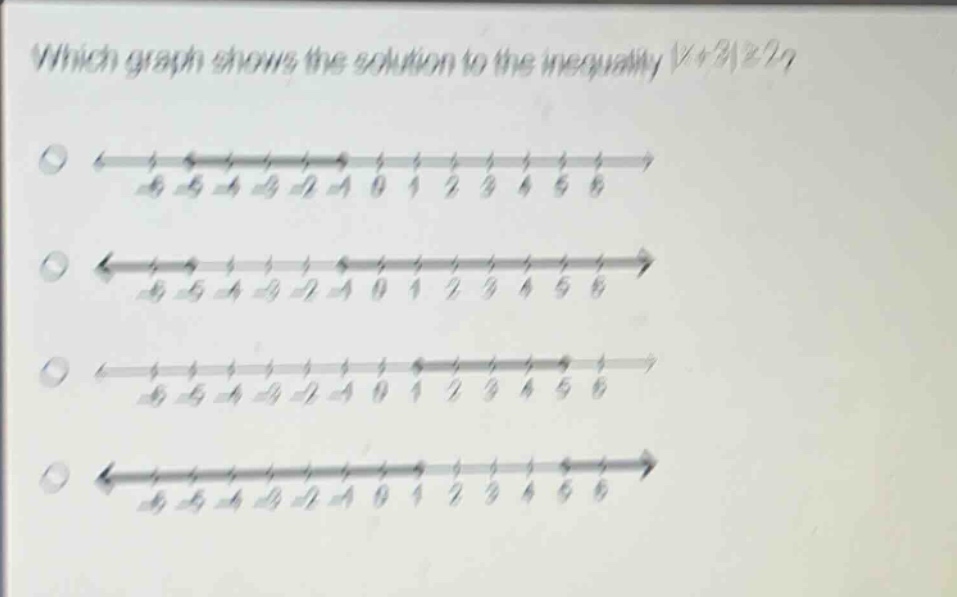
The solution corresponds to the graph showing shading to the left of -5 (including -5) and to the right of -1 (including -1).
(Note: Since specific option labels are absent in the input, the textual description of the correct graph is provided. If options were labeled, the answer would specify the corresponding option identifier.)
Explanation:
Step 1: Solve the absolute value inequality
The inequality (|x + 3| \geq 2) translates to two cases:
(x + 3 \geq 2) or (x + 3 \leq -2).
Step 2: Solve each case separately
For (x + 3 \geq 2):
Subtract 3: (x \geq -1).
For (x + 3 \leq -2):
Subtract 3: (x \leq -5).
Step 3: Describe the solution on a number line
The solution includes all (x \leq -5) or (x \geq -1), represented by closed circles at -5 and -1 (since the inequality is "greater than or equal to") with shading to the left of -5 and right of -1.