which graph shows the solution to the inequality -3x - 7 < 20?
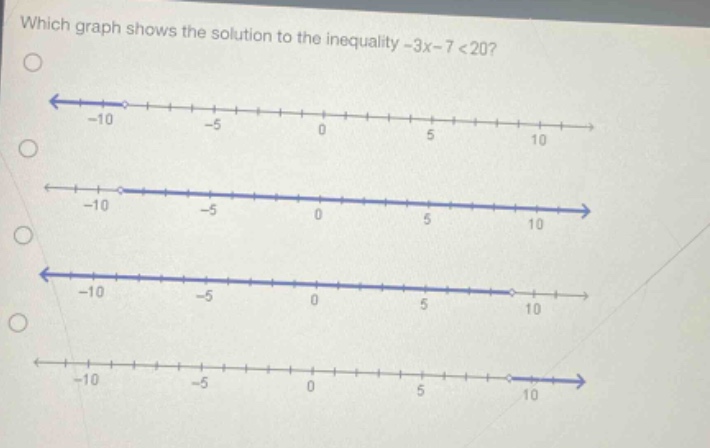
which graph shows the solution to the inequality -3x - 7 < 20?
Answer
Explanation:
Step1: Isolate the variable term
Add 7 to both sides of the inequality $-3x - 7<20$. We get $-3x-7 + 7<20 + 7$, which simplifies to $-3x<27$.
Step2: Solve for x
Divide both sides of the inequality $-3x<27$ by - 3. When dividing an inequality by a negative number, the direction of the inequality sign changes. So $\frac{-3x}{-3}>\frac{27}{-3}$, which gives $x > - 9$.
The solution of the inequality $x>-9$ is represented by a number - line with an open circle at - 9 and the line extending to the right.
Answer:
The second graph (the one with an open - circle at - 10 and the line extending to the right) since it represents all values of $x$ greater than - 9.