which graph shows the solution to the system of linear inequalities?\nx + 3y > 6\ny ≥ 2x + 4
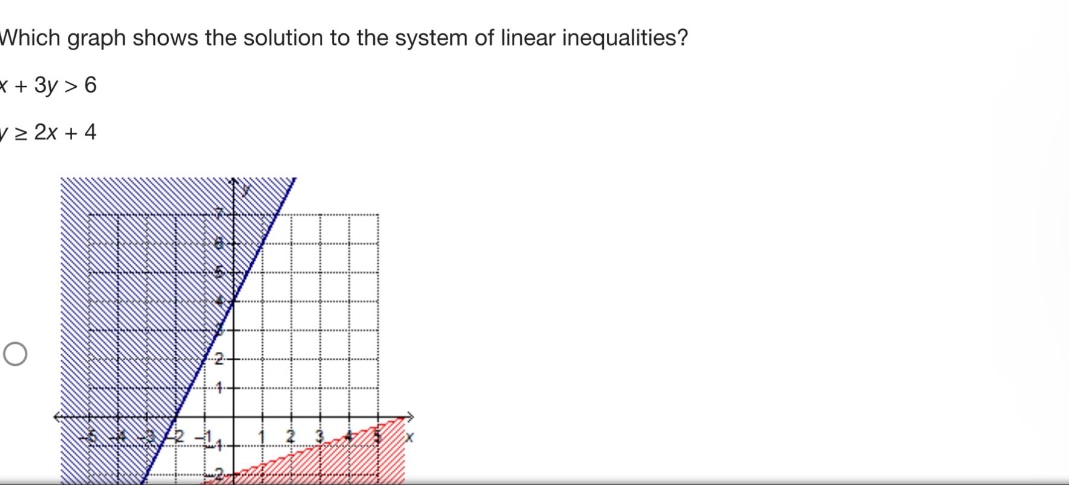
which graph shows the solution to the system of linear inequalities?\nx + 3y > 6\ny ≥ 2x + 4
Answer
Explanation:
Step1: Rewrite first inequality in slope - intercept form
Rewrite $x + 3y>6$ as $y>-\frac{1}{3}x + 2$. The boundary line is $y =-\frac{1}{3}x+2$ and it is a dashed line (since the inequality is $>$) and the region above this line is part of the solution for this inequality.
Step2: Analyze second inequality
The inequality $y\geq2x + 4$ has a boundary line $y = 2x+4$ which is a solid line (because of $\geq$) and the region above this line is part of its solution.
Step3: Find the overlapping region
The solution to the system of inequalities is the region that satisfies both inequalities, i.e., the overlapping region of the regions defined by each individual inequality.
Answer:
The graph that has a dashed line $y =-\frac{1}{3}x + 2$ with the region above it shaded, a solid line $y=2x + 4$ with the region above it shaded, and shows the overlapping shaded region correctly represents the solution to the system of linear inequalities. Without seeing all the options, we can't pick a specific graph from the choices given, but the described characteristics should be present in the correct graph.