which graph shows the solution to the system of linear inequalities?\nx + 5y≥5\ny≤2x + 4
which graph shows the solution to the system of linear inequalities?\nx + 5y≥5\ny≤2x + 4
Answer
Explanation:
Step1: Analyze the first inequality $x + 5y \ge 5$.
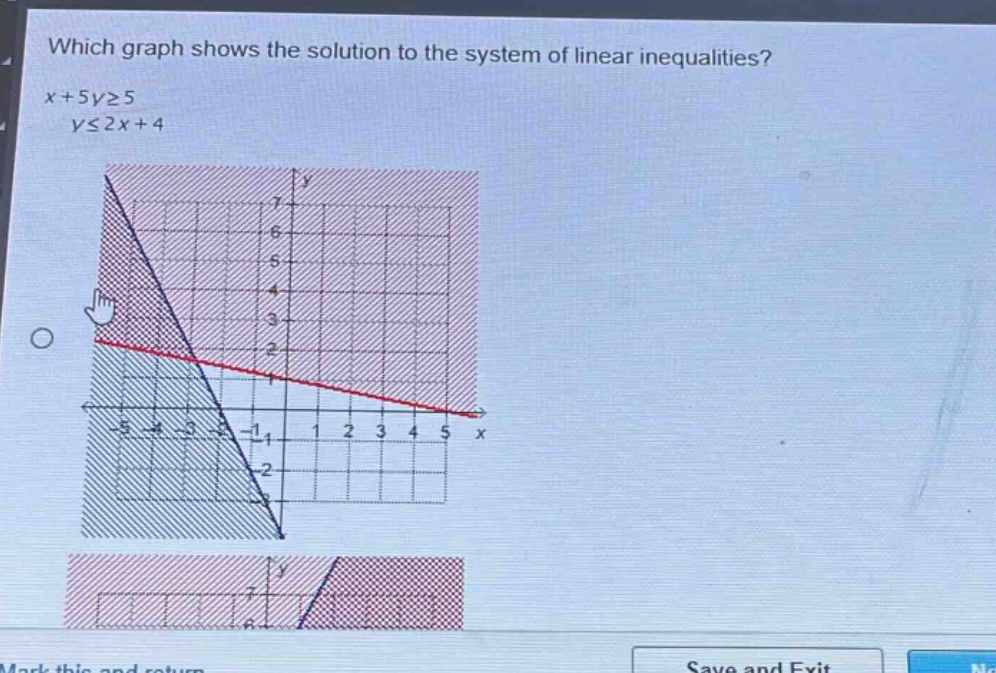
Rewrite the inequality in slope-intercept form: $5y \ge -x + 5$ $y \ge -\frac{1}{5}x + 1$ The boundary line is $y = -\frac{1}{5}x + 1$. It has a y-intercept of 1 and a slope of $-\frac{1}{5}$. The inequality $\ge$ indicates a solid line and shading above the line. The red line in the graph matches this boundary line (passes through (0,1) and (5,0)) and the red shaded region is above it.
Step2: Analyze the second inequality $y \le 2x + 4$.
The boundary line is $y = 2x + 4$. It has a y-intercept of 4 and a slope of 2. The inequality $\le$ indicates a solid line and shading below the line. The blue line in the graph matches this boundary line (passes through (0,4) and (-2,0)) and the blue shaded region is below it.
Step3: Identify the solution region.
The solution to the system of inequalities is the intersection of the shaded regions from Step 1 and Step 2. This corresponds to the region shaded with both red and blue hatching (the overlapping darker purple area).
Answer:
The provided graph correctly shows the solution to the system of linear inequalities $x+5y \ge 5$ and $y \le 2x+4$. The solution is the overlapping shaded region.