which graph shows the solution to the system of linear inequalities?\ny > \\frac{2}{3}x + 3\ny \\leq…
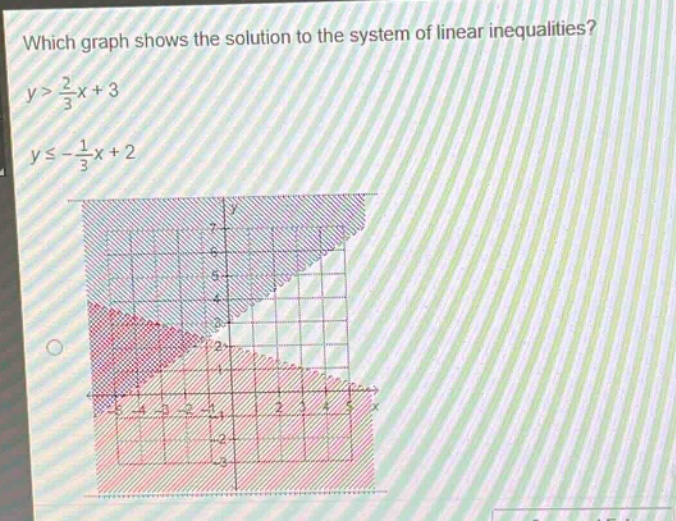
which graph shows the solution to the system of linear inequalities?\ny > \\frac{2}{3}x + 3\ny \\leq -\\frac{1}{3}x + 2
Answer
Explanation:
Step1: Analyze the first inequality
The inequality $y>\frac{2}{3}x + 3$ has a boundary - line $y=\frac{2}{3}x + 3$ which is a straight - line with slope $\frac{2}{3}$ and y - intercept 3. Since it is $y>\frac{2}{3}x + 3$, the region above this line (dashed line because the inequality is strict) is part of the solution.
Step2: Analyze the second inequality
The inequality $y\leq-\frac{1}{3}x + 2$ has a boundary - line $y =-\frac{1}{3}x+2$ which is a straight - line with slope $-\frac{1}{3}$ and y - intercept 2. Since it is $y\leq-\frac{1}{3}x + 2$, the region below this line (solid line because the inequality is non - strict) is part of the solution.
Step3: Find the intersection region
The solution to the system of inequalities is the region that satisfies both inequalities simultaneously, which is the intersection of the regions determined by each inequality.
Answer:
The graph that shows the region above the dashed line $y=\frac{2}{3}x + 3$ and below the solid line $y=-\frac{1}{3}x + 2$. (Since no specific options are given in a proper multiple - choice format, this is a general description of the correct graph).