the graph below shows the total cost for lunch, c, when will and his friends buy a large salad to share and…
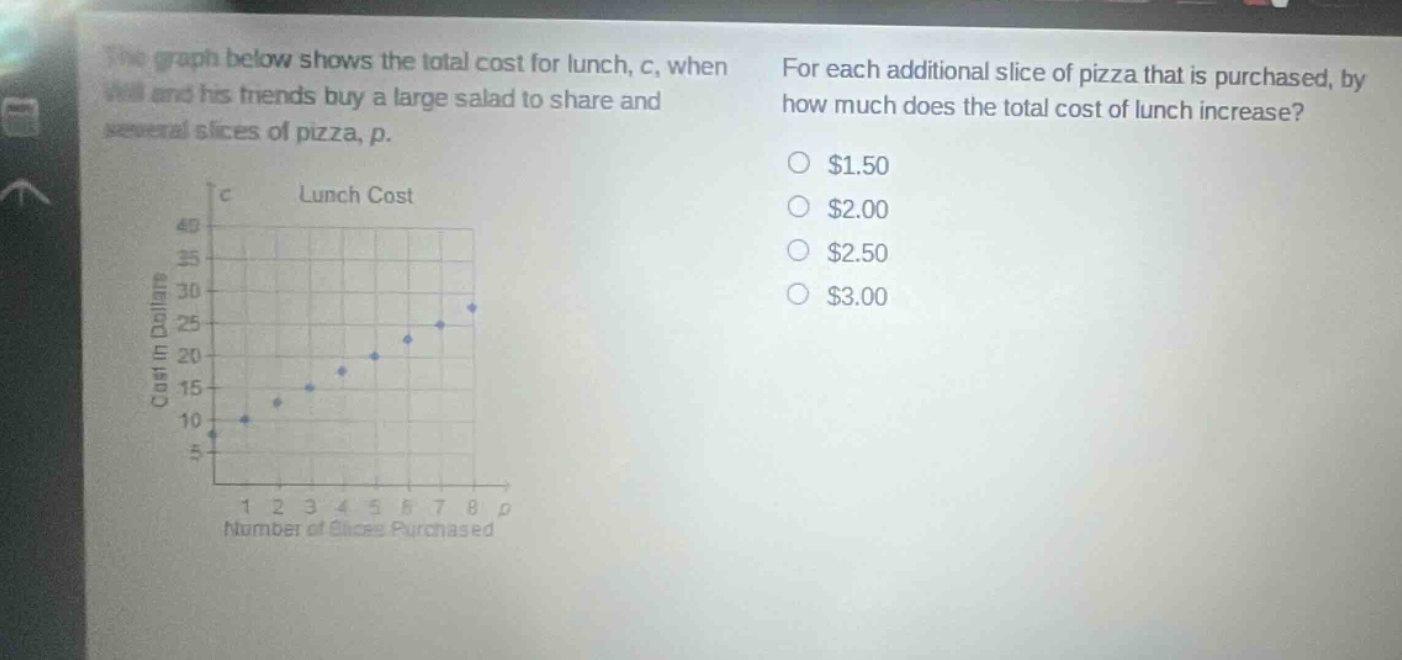
the graph below shows the total cost for lunch, c, when will and his friends buy a large salad to share and several slices of pizza, p. for each additional slice of pizza that is purchased, by how much does the total cost of lunch increase? $1.50 $2.00 $2.50 $3.00
Answer
Explanation:
Step1: Select two points
Let's take two points on the graph: (1, 10) and (2, 12.5).
Step2: Calculate the slope
The slope formula is $m=\frac{y_2 - y_1}{x_2 - x_1}$. Here, $x_1 = 1,y_1 = 10,x_2 = 2,y_2 = 12.5$. So $m=\frac{12.5 - 10}{2 - 1}=\frac{2.5}{1}=2.5$. The slope represents the increase in cost per additional slice of pizza.
Answer:
$2.50