which is the graph of the solution set of 5x + 8y > 50?
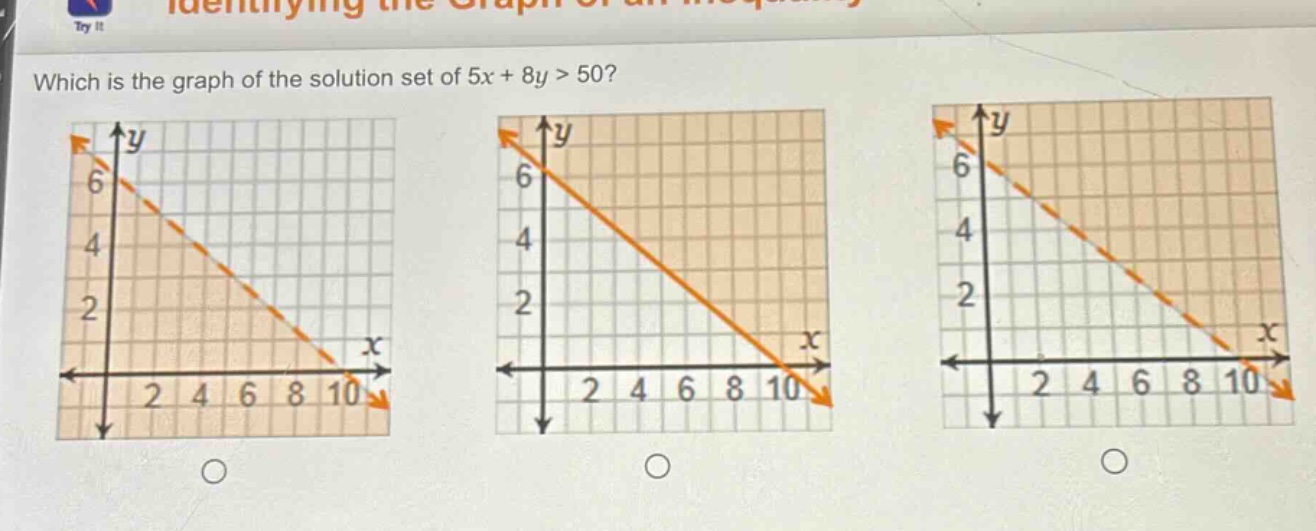
which is the graph of the solution set of 5x + 8y > 50?
Answer
Explanation:
Step1: Rewrite the inequality in slope - intercept form
First, solve $5x + 8y>50$ for $y$. Subtract $5x$ from both sides: $8y>- 5x + 50$. Then divide by 8: $y>-\frac{5}{8}x+\frac{50}{8}=-\frac{5}{8}x+\frac{25}{4}$.
Step2: Analyze the boundary line
The boundary line of the inequality $y>-\frac{5}{8}x+\frac{25}{4}$ is $y =-\frac{5}{8}x+\frac{25}{4}$. The slope $m =-\frac{5}{8}$ and the y - intercept $b=\frac{25}{4}=6.25$. Since the inequality is $y>-\frac{5}{8}x+\frac{25}{4}$, the boundary line is dashed.
Step3: Test a point
Test the point $(0,0)$. Substitute $x = 0$ and $y = 0$ into the original inequality $5x+8y>50$. We get $5(0)+8(0)=0$, and $0\not>50$. So the solution set does not contain the origin, and the shaded region is above the dashed line.
Answer:
The graph with a dashed line having a negative slope and the shaded region above the line.