which is the graph of $f(x)=sqrt{x}$?
which is the graph of $f(x)=sqrt{x}$?
Answer
Explanation:
Step1: Analyze domain of function
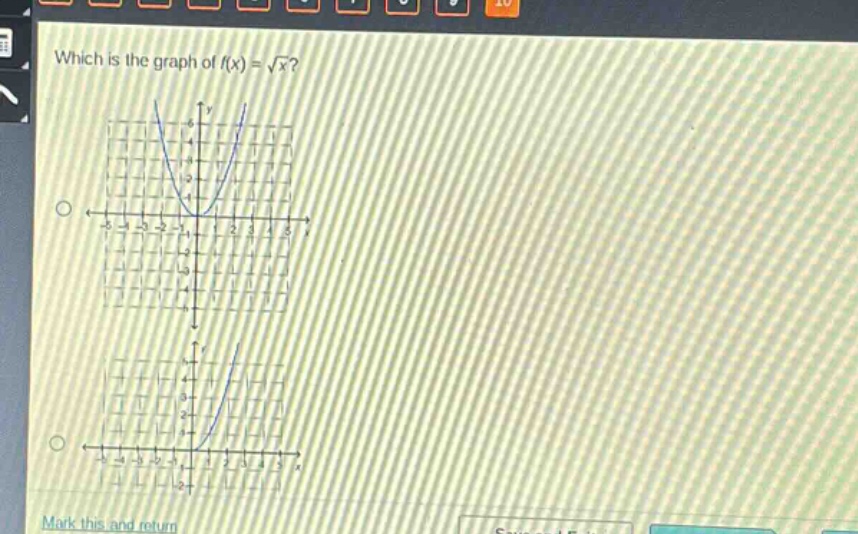
The function $f(x)=\sqrt{x}$ has a domain of $x\geq0$ since we cannot take the square - root of a negative number in the set of real numbers.
Step2: Analyze some key points
When $x = 0$, $f(0)=\sqrt{0}=0$; when $x = 1$, $f(1)=\sqrt{1}=1$; when $x = 4$, $f(4)=\sqrt{4}=2$. The graph of $y = \sqrt{x}$ starts at the origin $(0,0)$ and is a curve that increases as $x$ increases for non - negative $x$ values.
Answer:
The graph that starts at the origin $(0,0)$ and is only in the first - quadrant (since $x\geq0$ and $y=\sqrt{x}\geq0$) and is a curve increasing for positive $x$ values is the correct graph of $f(x)=\sqrt{x}$. Without seeing the full options clearly, the graph that has these characteristics is the answer. If we assume the two graphs shown are the only options, the graph that starts at $(0,0)$ and is in the first - quadrant with a curve shape for $x\geq0$ is the graph of $y = \sqrt{x}$.