which is the graph of the system $x + 3y > - 3$ and $y < \frac{1}{2}x + 1$?
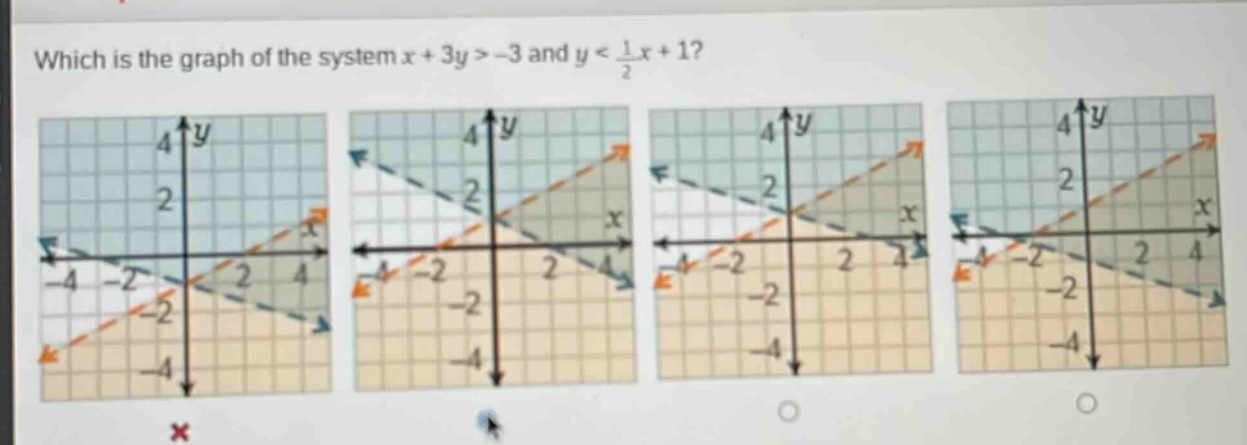
which is the graph of the system $x + 3y > - 3$ and $y < \frac{1}{2}x + 1$?
Answer
Explanation:
Step1: Rewrite the first inequality
Rewrite $x + 3y>-3$ in slope - intercept form $y=mx + b$. Subtract $x$ from both sides: $3y>-x - 3$. Then divide by 3: $y>-\frac{1}{3}x - 1$. The boundary line is $y =-\frac{1}{3}x - 1$ and the region above this dashed line (since the inequality is $>$) is part of the solution.
Step2: Analyze the second inequality
The second inequality is $y<\frac{1}{2}x + 1$. The boundary line is $y=\frac{1}{2}x + 1$ and the region below this dashed line (since the inequality is $<$) is part of the solution.
Step3: Find the overlapping region
The solution of the system is the region that satisfies both inequalities, which is the region that is above $y =-\frac{1}{3}x - 1$ and below $y=\frac{1}{2}x + 1$.
Answer:
The graph with the region above the line $y =-\frac{1}{3}x - 1$ (dashed) and below the line $y=\frac{1}{2}x + 1$ (dashed). (Since no specific option labels are given, a description of the correct graph is provided).