the graph of a system of inequalities is shown. which system is represented by the graph? y > 2x x + 2y ≤ -8…
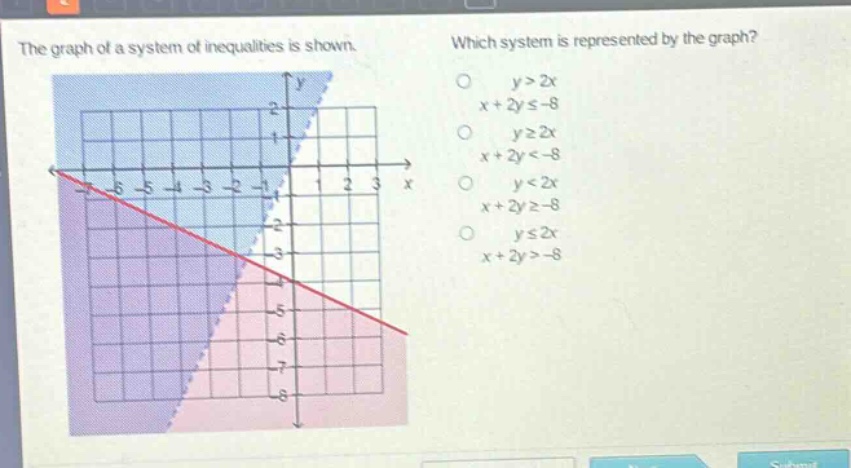
the graph of a system of inequalities is shown. which system is represented by the graph? y > 2x x + 2y ≤ -8 y ≥ 2x x + 2y < -8 y < 2x x + 2y ≥ -8 y ≤ 2x x + 2y > -8
Answer
Answer:
A. $y > 2x$, $x + 2y\leq - 8$
Explanation:
Step1: Analyze the line $y = 2x$
The dashed - line $y = 2x$ has a slope of 2 and a y - intercept of 0. The shaded region above this line indicates $y>2x$ (since it's a dashed line, the points on the line are not included).
Step2: Analyze the line $x + 2y=-8$
Rewrite $x + 2y=-8$ as $y=-\frac{1}{2}x - 4$. The solid line $x + 2y=-8$ has a slope of $-\frac{1}{2}$ and a y - intercept of - 4. The shaded region below this line indicates $x + 2y\leq - 8$ (since it's a solid line, the points on the line are included).