graph the system. use the graph to approximate the solution of the equation log(x + 1)=-x^2 + 10.
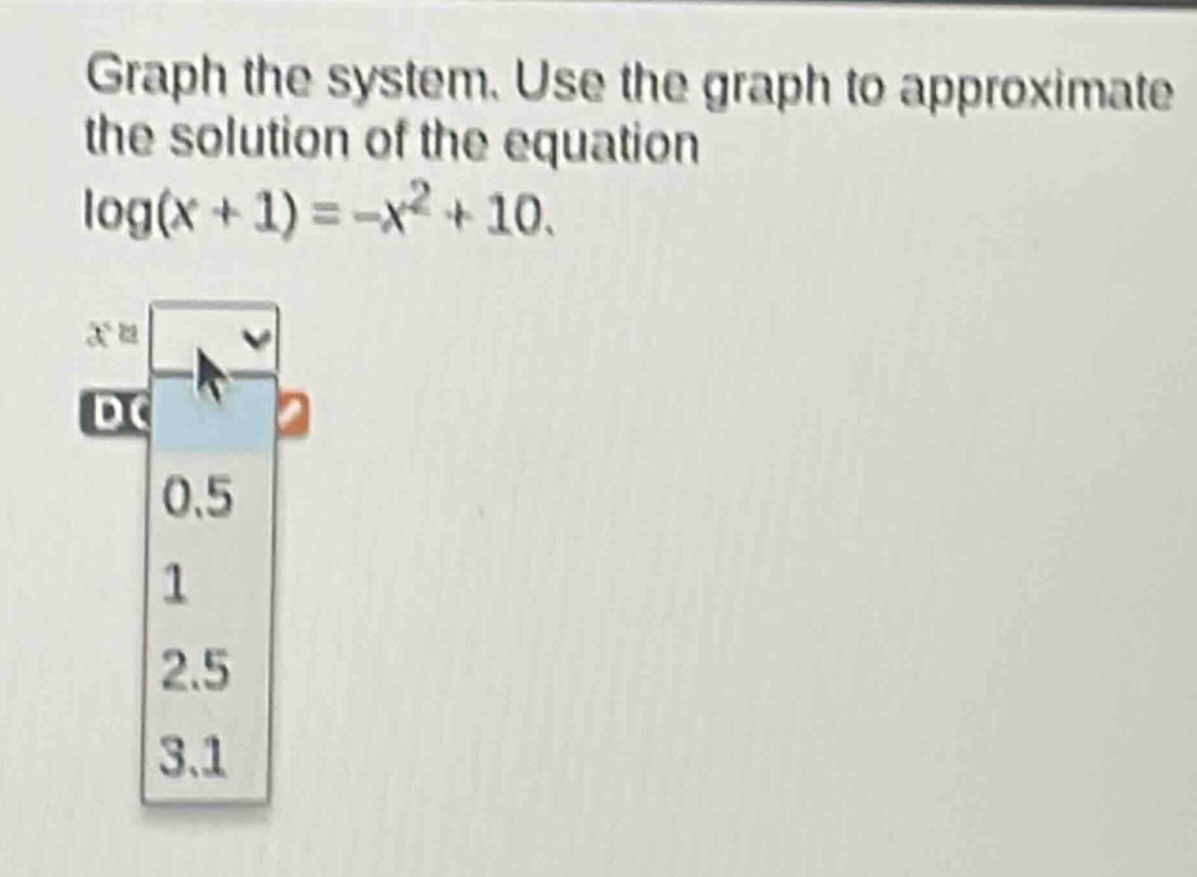
graph the system. use the graph to approximate the solution of the equation log(x + 1)=-x^2 + 10.
Answer
Explanation:
Step1: Define two functions for graphing
Let ( y_1 = \log(x + 1) ) and ( y_2 = -x^2 + 10 ).
Step2: Analyze domain and key points
For ( y_1 ), domain is ( x > -1 ). Key points: at ( x = 0 ), ( y_1 = 0 ); as ( x \to -1^+ ), ( y_1 \to -\infty ); grows slowly.
For ( y_2 ), it's a downward parabola with vertex ((0, 10)), intersecting ( y )-axis at 10.
Step3: Estimate intersection points graphically
Plot both functions. ( y_2 ) decreases from 10, while ( y_1 ) increases from (-\infty) to (+\infty) slowly. They likely intersect twice in ( x > -1 ). Test values:
- At ( x = 3 ), ( y_1 = \log(4) \approx 0.602 ), ( y_2 = -9 + 10 = 1 ) → ( y_1 < y_2 ).
- At ( x = 3.1 ), ( y_2 = -(3.1)^2 + 10 = -9.61 + 10 = 0.39 ), ( y_1 = \log(4.1) \approx 0.613 ) → ( y_1 > y_2 ).
- At ( x = 2.5 ), ( y_2 = -6.25 + 10 = 3.75 ), ( y_1 = \log(3.5) \approx 0.544 ) → ( y_1 < y_2 ).
- At ( x = 1 ), ( y_1 = \log(2) \approx 0.301 ), ( y_2 = -1 + 10 = 9 ) → ( y_1 < y_2 ).
- At ( x = 0.5 ), ( y_1 = \log(1.5) \approx 0.176 ), ( y_2 = -0.25 + 10 = 9.75 ) → ( y_1 < y_2 ).
Step4: Narrow down the right intersection
Between ( x = 3 ) and ( x = 3.1 ), ( y_1 ) crosses ( y_2 ). Using linear approximation or graph estimation, the solution is near ( x \approx 3.1 ).
Answer:
3.1