graphing an inequality in two variables\ngraph: $y < \\frac{1}{3}x+\\frac{1}{2}$\nclick or tap the graph to…
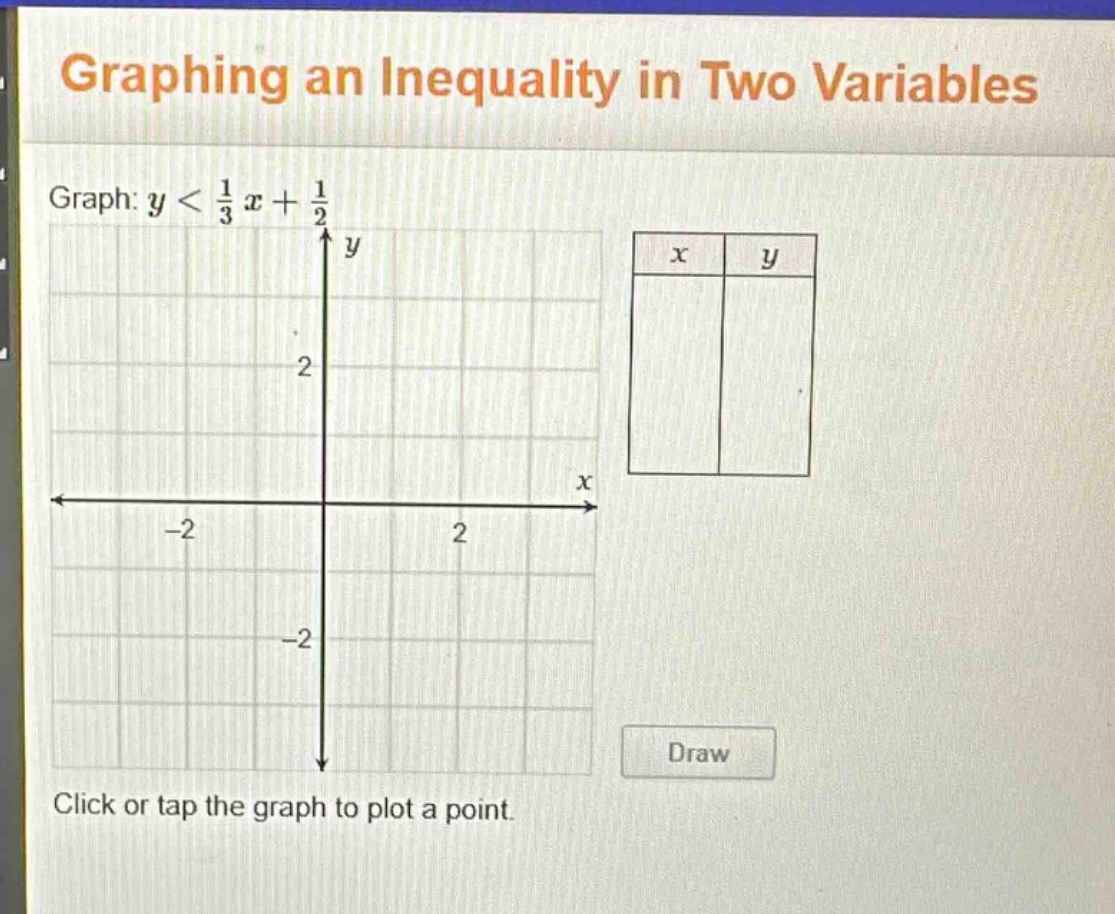
graphing an inequality in two variables\ngraph: $y < \\frac{1}{3}x+\\frac{1}{2}$\nclick or tap the graph to plot a point.
Answer
Explanation:
Step1: Identify the boundary - line equation
The boundary - line for the inequality $y<\frac{1}{3}x+\frac{1}{2}$ is $y = \frac{1}{3}x+\frac{1}{2}$.
Step2: Find the y - intercept
Set $x = 0$ in $y=\frac{1}{3}x+\frac{1}{2}$. Then $y=\frac{1}{2}$. So the y - intercept is the point $(0,\frac{1}{2})$.
Step3: Find the x - intercept
Set $y = 0$ in $y=\frac{1}{3}x+\frac{1}{2}$. Then $0=\frac{1}{3}x+\frac{1}{2}$, which gives $\frac{1}{3}x=-\frac{1}{2}$, and $x =-\frac{3}{2}$. So the x - intercept is the point $(-\frac{3}{2},0)$.
Step4: Determine the type of line
Since the inequality is $y<\frac{1}{3}x+\frac{1}{2}$ (a strict inequality), the boundary - line $y=\frac{1}{3}x+\frac{1}{2}$ is a dashed line.
Step5: Test a point
Choose a test - point not on the line, say $(0,0)$. Substitute $x = 0$ and $y = 0$ into the inequality $y<\frac{1}{3}x+\frac{1}{2}$. We get $0<\frac{1}{3}(0)+\frac{1}{2}$, or $0<\frac{1}{2}$, which is true. So we shade the region that contains the point $(0,0)$.
To graph:
- Plot the y - intercept $(0,\frac{1}{2})$ and the x - intercept $(-\frac{3}{2},0)$.
- Draw a dashed line through these two points.
- Shade the region below the dashed line.
Answer:
Graph a dashed line through the points $(0,\frac{1}{2})$ and $(-\frac{3}{2},0)$ and shade the region below the line.