graphing linear equations\nvectored instruction\ngraph the\n equation by filling\n in the chart.\nequation:\n…
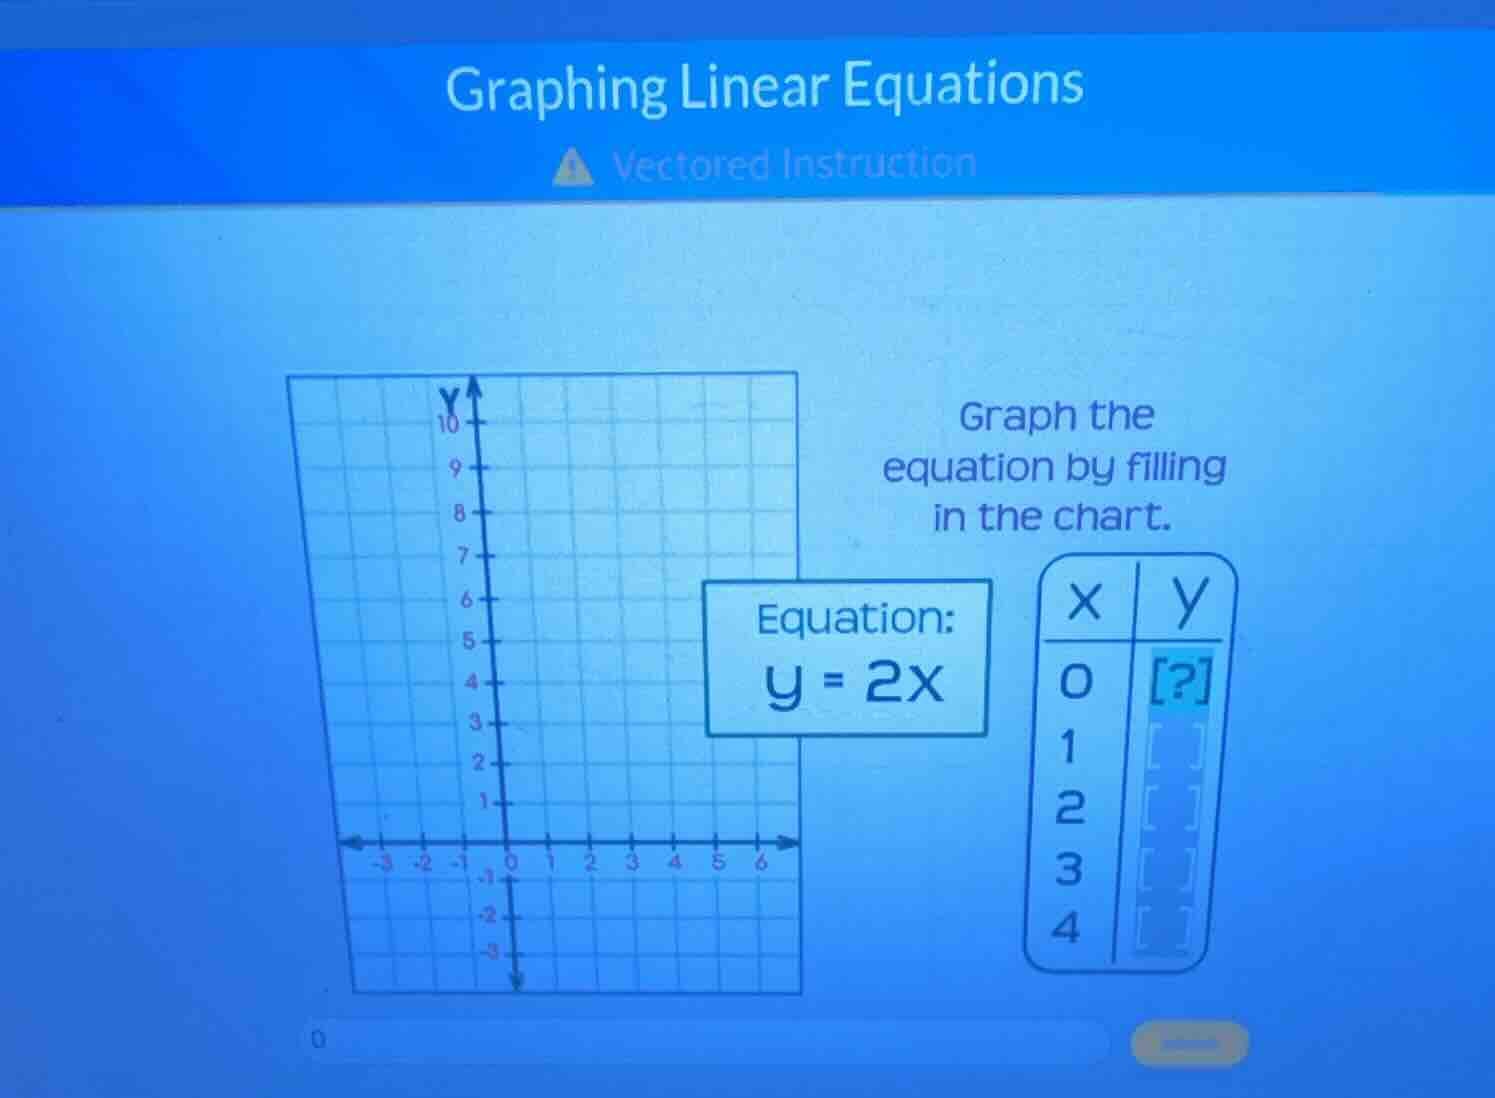
graphing linear equations\nvectored instruction\ngraph the\n equation by filling\n in the chart.\nequation:\n y = 2x\nx | y\n0 ?\n1 \n2 \n3 \n4
Answer
Explanation:
Step1: Substitute x = 0 into the equation
We have the equation ( y = 2x ). When ( x = 0 ), we substitute ( x ) with 0 in the equation. So ( y = 2\times0 ).
Step2: Calculate the value of y
( 2\times0 = 0 ), so when ( x = 0 ), ( y = 0 ).
For the other values of ( x ):
- When ( x = 1 ), ( y = 2\times1 = 2 )
- When ( x = 2 ), ( y = 2\times2 = 4 )
- When ( x = 3 ), ( y = 2\times3 = 6 )
- When ( x = 4 ), ( y = 2\times4 = 8 )
Answer:
For ( x = 0 ), ( y = 0 ); for ( x = 1 ), ( y = 2 ); for ( x = 2 ), ( y = 4 ); for ( x = 3 ), ( y = 6 ); for ( x = 4 ), ( y = 8 )
(If only the value for ( x = 0 ) is needed, the answer is ( 0 ))