which of these graphs do not represent constant rates of change? check all that apply.
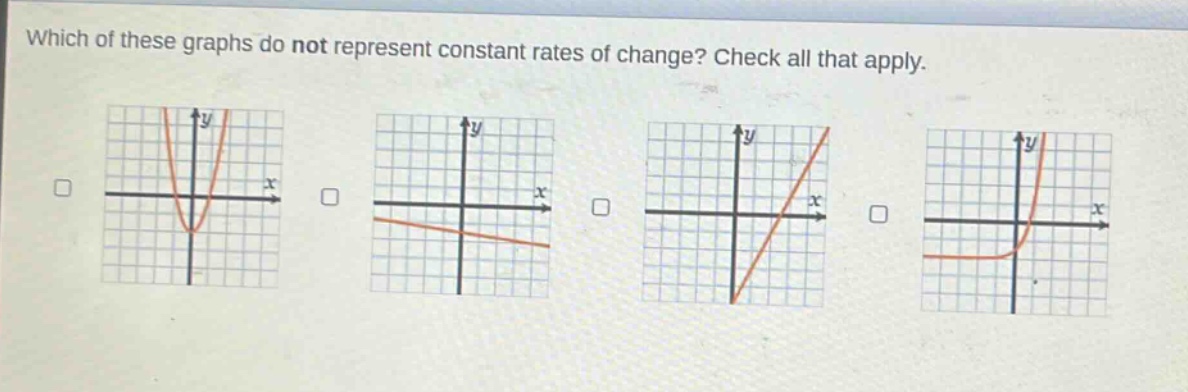
which of these graphs do not represent constant rates of change? check all that apply.
Answer
Explanation:
Step1: Recall rate - of - change concept
The rate of change of a function is constant if its graph is a non - vertical straight line. A non - straight line graph has a non - constant rate of change.
Step2: Analyze each graph
- The first graph is a parabola (a quadratic function (y = ax^{2}+bx + c,a\neq0)). Its slope changes at different points, so it does not have a constant rate of change.
- The second graph is a curve (not a straight line), so its rate of change is not constant.
- The third graph is a straight line. The rate of change (slope) of a straight line (y=mx + b) is (m) (constant).
- The fourth graph is a curve (not a straight line), so its rate of change is not constant.
Answer:
The first graph, the second graph, the fourth graph.