the graphs below shows some properties of regular polygons. when compared with the independent variable, how…
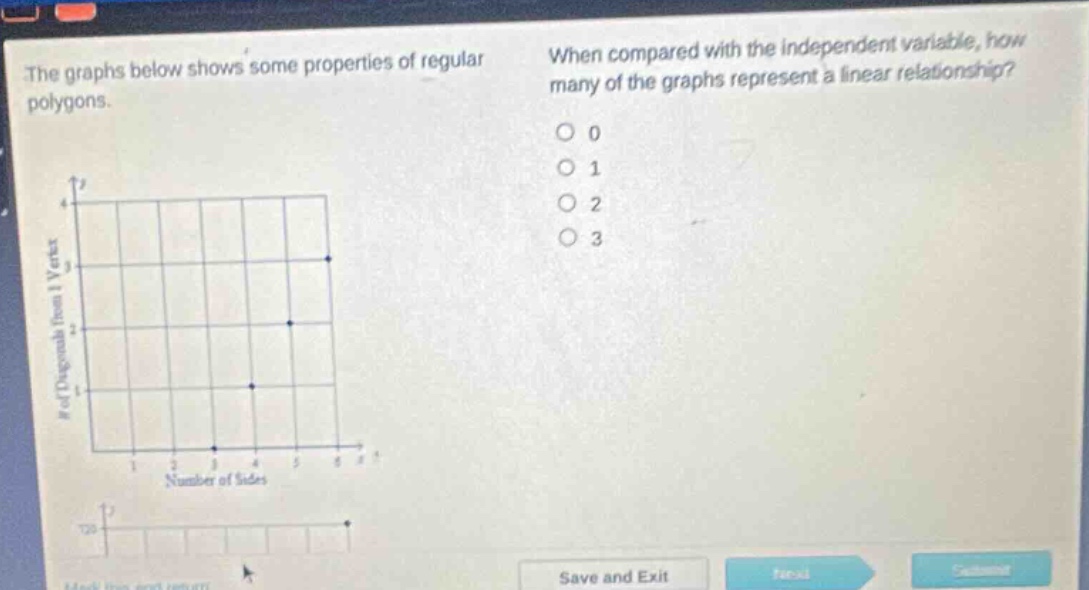
the graphs below shows some properties of regular polygons. when compared with the independent variable, how many of the graphs represent a linear relationship? 0 1 2 3
Answer
Explanation:
Step1: Recall linear - relationship definition
A linear relationship has a constant rate of change and its graph is a straight - line. The general form of a linear equation is $y = mx + b$, where $m$ is the slope and $b$ is the y - intercept.
Step2: Analyze the graph of number of diagonals from 1 vertex vs number of sides
The formula for the number of diagonals $d$ from a single vertex of an $n$ - sided polygon is $d=n - 3$. This is a linear equation with slope $m = 1$ and y - intercept $b=-3$. When we plot the number of diagonals from 1 vertex ($y$) against the number of sides ($x$), we get a straight - line graph.
Step3: Analyze the second graph (not shown completely but assume it's related to polygon properties)
Since no information about the second graph is given, assume it's not linear.
Answer:
1