a grocery bag contains x apples, each weighing $\frac{1}{3}$ of a pound, and y pounds of grapes. the total…
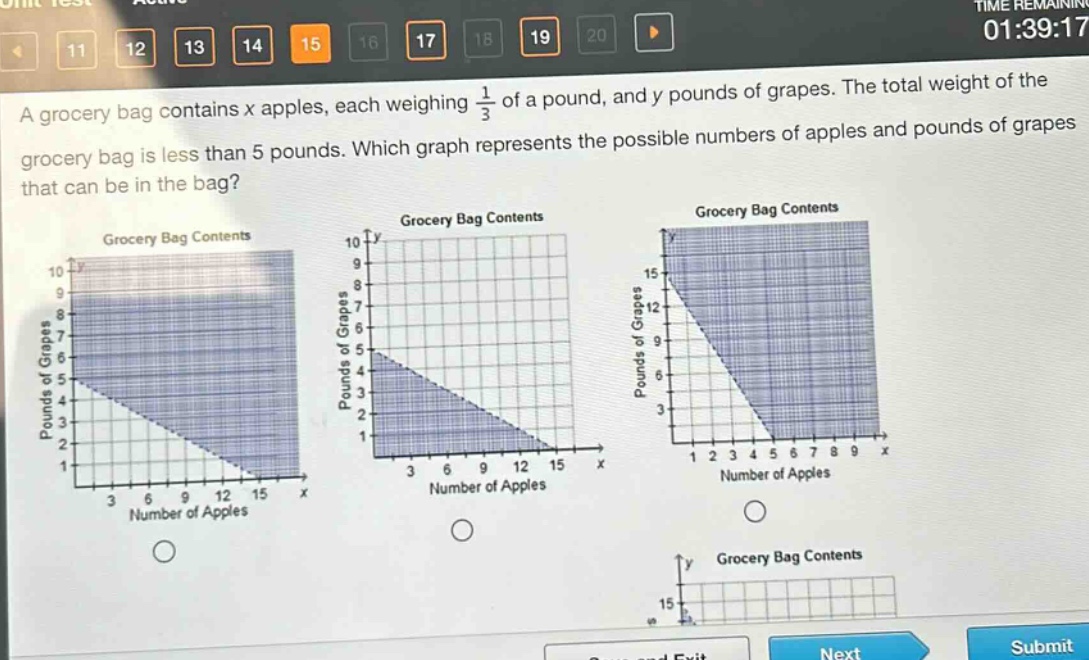
a grocery bag contains x apples, each weighing $\frac{1}{3}$ of a pound, and y pounds of grapes. the total weight of the grocery bag is less than 5 pounds. which graph represents the possible numbers of apples and pounds of grapes that can be in the bag?
Answer
Explanation:
Step1: Set up the inequality
The weight of the apples is $\frac{1}{3}x$ pounds (since each of $x$ apples weighs $\frac{1}{3}$ pound) and the weight of the grapes is $y$ pounds. The total weight is less than 5 pounds, so the inequality is $\frac{1}{3}x + y<5$.
Step2: Rewrite the inequality in slope - intercept form
Subtract $\frac{1}{3}x$ from both sides to get $y < -\frac{1}{3}x + 5$. The boundary line is $y=-\frac{1}{3}x + 5$, which has a y - intercept of 5 and a slope of $-\frac{1}{3}$. Since the inequality is $y<-\frac{1}{3}x + 5$, the region below the line (dashed because the inequality is strict) represents the solution set. Also, since $x\geq0$ (number of apples can't be negative) and $y\geq0$ (pounds of grapes can't be negative), the solution is in the first - quadrant below the line $y =-\frac{1}{3}x+5$.
Answer:
The graph with the line $y =-\frac{1}{3}x + 5$ as a dashed line and the region below it in the first - quadrant.