identify the graph that correctly represents the inequality |x + 1|+2 > 5.
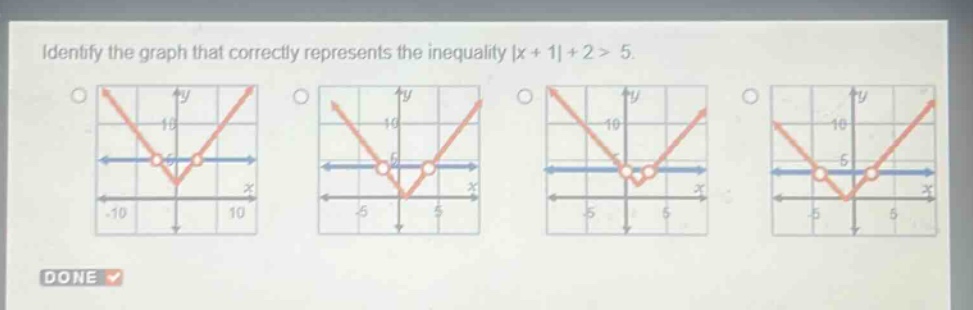
identify the graph that correctly represents the inequality |x + 1|+2 > 5.
Answer
Answer:
First, solve the inequality (|x + 1|+2>5). Subtract 2 from both sides of the inequality: ( |x + 1|>5 - 2), so (|x + 1|>3). This implies two cases: Case 1: (x+1>3), then (x>3 - 1), so (x>2). Case 2: (x + 1<-3), then (x<-3 - 1), so (x<-4). The graph will have an open - circle at (x=-4) and an arrow pointing to the left, and an open - circle at (x = 2) and an arrow pointing to the right.
Explanation:
Step1: Isolate the absolute - value expression
Subtract 2 from both sides of (|x + 1|+2>5) to get (|x + 1|>3). (|x + 1|+2-2>5 - 2\Rightarrow|x + 1|>3)
Step2: Split into two cases
For (|a|>b) ((b>0)), we have (a>b) or (a<-b). Here (a=x + 1) and (b = 3), so (x+1>3) or (x + 1<-3).
Step3: Solve the first case
Solve (x+1>3). Subtract 1 from both sides: (x+1-1>3 - 1), so (x>2).
Step4: Solve the second case
Solve (x + 1<-3). Subtract 1 from both sides: (x+1-1<-3 - 1), so (x<-4).