identifying the graph of an inequality\nwhich is the graph of 2x + 3y > -3?
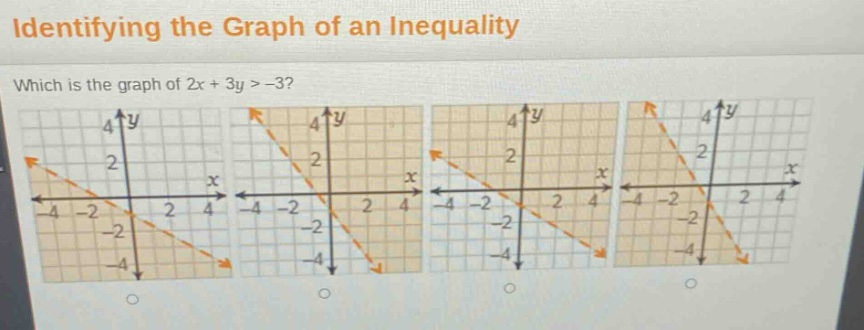
identifying the graph of an inequality\nwhich is the graph of 2x + 3y > -3?
Answer
Explanation:
Step1: Rewrite the inequality in slope - intercept form
First, solve (2x + 3y>-3) for (y). Subtract (2x) from both sides: (3y>-2x - 3). Then divide by 3: (y>-\frac{2}{3}x - 1).
Step2: Analyze the boundary line
The boundary line of the inequality (y>-\frac{2}{3}x - 1) is (y =-\frac{2}{3}x - 1). Since the inequality is (y>-\frac{2}{3}x - 1) (not (y\geq-\frac{2}{3}x - 1)), the boundary line is dashed.
Step3: Test a point
Let's test the point ((0,0)). Substitute (x = 0) and (y = 0) into the original inequality (2x+3y>-3). We get (2(0)+3(0)=0), and (0>-3) which is true. So the region that contains the point ((0,0)) is the solution region.
Answer:
The graph with a dashed line having a slope of (-\frac{2}{3}) and (y) - intercept of (- 1) and the region above the line (the region that contains the origin ((0,0))) is the correct graph. Without specific labels on the given graphs, you would look for the graph that has a dashed line (y =-\frac{2}{3}x - 1) and the area above this line shaded.