identifying the graph of an inequality\nwhich is the graph of 4x + 2y < 3?
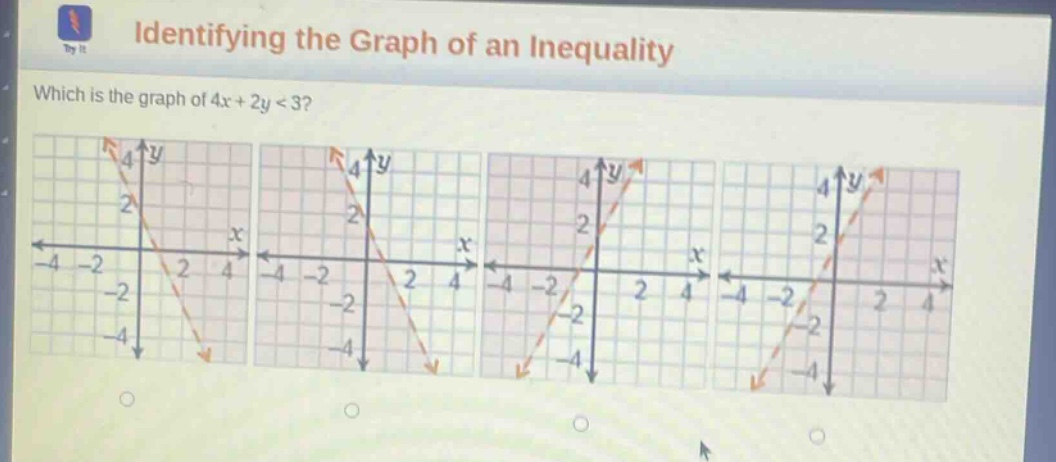
identifying the graph of an inequality\nwhich is the graph of 4x + 2y < 3?
Answer
Explanation:
Step1: Rewrite the inequality in slope - intercept form
First, solve (4x + 2y<3) for (y). Subtract (4x) from both sides: (2y<-4x + 3). Then divide by 2: (y<-2x+\frac{3}{2}).
Step2: Analyze the slope and y - intercept
The slope (m=-2) and the y - intercept (b = \frac{3}{2}=1.5). The inequality is (y <) a linear function, so the boundary line (y=-2x+\frac{3}{2}) is dashed (since the inequality is strict, (y<) not (y\leq)). Also, since (y) is less than the linear function, the shaded region is below the line.
Step3: Check the graph
The graph with a dashed line having a slope of (- 2) (going down 2 units for every 1 unit to the right) and y - intercept of (1.5) and shaded below the line is the correct one.
Answer:
The graph with a dashed line having slope (-2), y - intercept (1.5) and shaded below the line.