identifying a negative interval using a graph\nwhich function is negative for the interval -1, 1?
identifying a negative interval using a graph\nwhich function is negative for the interval -1, 1?
Answer
Answer:
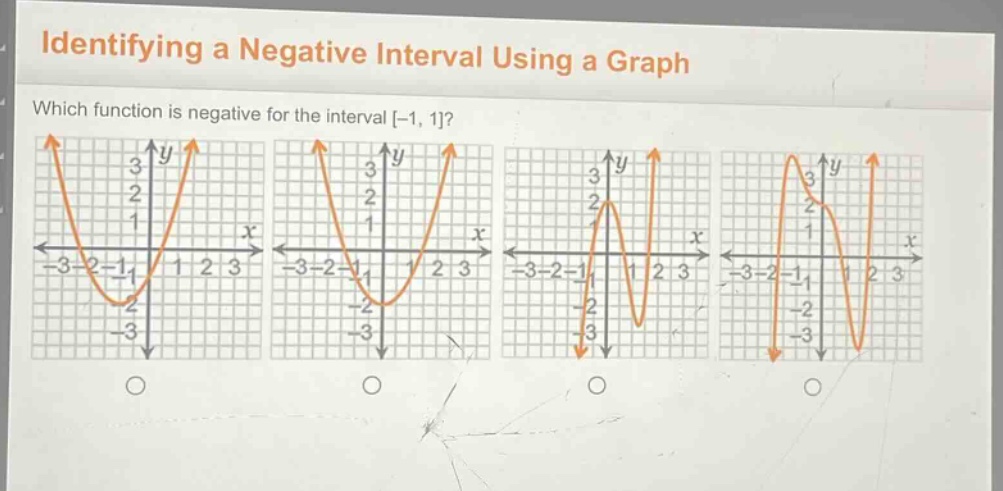
We need to visually inspect each graph to see which one has (y - values) less than (0) (negative) for all (x) - values in the interval ([-1,1]).
- For the first graph:
- When (x\in[-1,1]), the (y) - values are negative.
- For the second graph:
- When (x = 0), (y= - 2), but when (x=\pm1), (y = 0), so it is not negative for the entire interval ([-1,1]).
- For the third graph:
- When (x\in[-1,1]), the (y) - values are non - negative ( (y\geq0)).
- For the fourth graph:
- When (x\in[-1,1]), the (y) - values are non - negative ( (y\geq0)).
So the function represented by the first graph is negative for the interval ([-1,1]).
Explanation:
Step1: Analyze first graph
Check (y) values in ([-1,1]). All (y<0).
Step2: Analyze second graph
At (x = \pm1), (y = 0), not negative throughout.
Step3: Analyze third graph
All (y\geq0) in ([-1,1]).
Step4: Analyze fourth graph
All (y\geq0) in ([-1,1]).