an inequality is shown.\n4x + 5y ≥ 10\nwhich graph represents the solution set of the inequality?
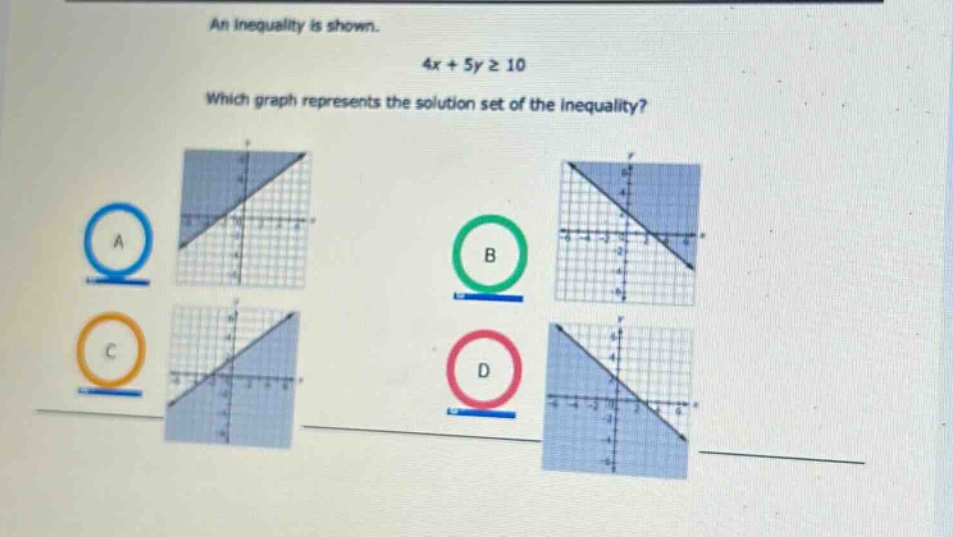
an inequality is shown.\n4x + 5y ≥ 10\nwhich graph represents the solution set of the inequality?
Answer
Explanation:
Step1: Rewrite the inequality in slope - intercept form
First, solve $4x + 5y\geq10$ for $y$. Subtract $4x$ from both sides: $5y\geq - 4x + 10$. Then divide by 5: $y\geq-\frac{4}{5}x + 2$.
Step2: Analyze the slope and y - intercept
The slope of the line is $m =-\frac{4}{5}$ and the y - intercept is $b = 2$. The inequality $y\geq-\frac{4}{5}x + 2$ means the region above the line $y=-\frac{4}{5}x + 2$ (since it's $y$ greater than or equal to the linear function). Also, since it's $\geq$, the line is solid.
Step3: Check the graphs
We look for a graph with a solid line having a negative slope of $-\frac{4}{5}$ and y - intercept of 2, and the region above the line shaded.
Answer:
The correct graph is the one that has a solid line with a negative slope and the region above the line shaded. Without seeing the exact details of each graph, if we assume the standard orientation of axes, the graph with a solid line crossing the y - axis at 2 and sloping downwards with a slope of $-\frac{4}{5}$ and the area above the line shaded is the correct one. If we had to choose based on typical graph - reading, we would need to visually inspect which of A, B, C, D has a solid line $y =-\frac{4}{5}x+2$ and the region above it shaded.