this is the input - output table for the linear function y = 3x. which best describes how the y - values are…
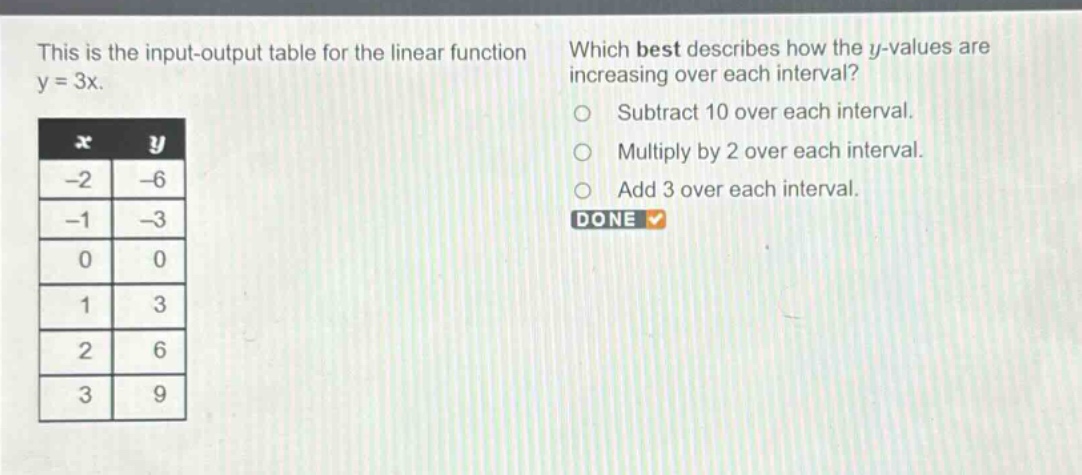
this is the input - output table for the linear function y = 3x. which best describes how the y - values are increasing over each interval? subtract 10 over each interval. multiply by 2 over each interval. add 3 over each interval. done
Answer
Explanation:
Step1: Check the change in y - values
For (x=-2,y = - 6); for (x=-1,y=-3). The change in (y) is (-3-(-6)=3). For (x=-1,y = - 3); for (x = 0,y = 0). The change in (y) is (0-(-3)=3). For (x = 0,y = 0); for (x = 1,y = 3). The change in (y) is (3 - 0=3). For (x = 1,y = 3); for (x = 2,y = 6). The change in (y) is (6 - 3=3). For (x = 2,y = 6); for (x = 3,y = 9). The change in (y) is (9 - 6=3).
Answer:
Add 3 over each interval.