instructions: create a table of values for the function graphed below using the plotted points. remember…
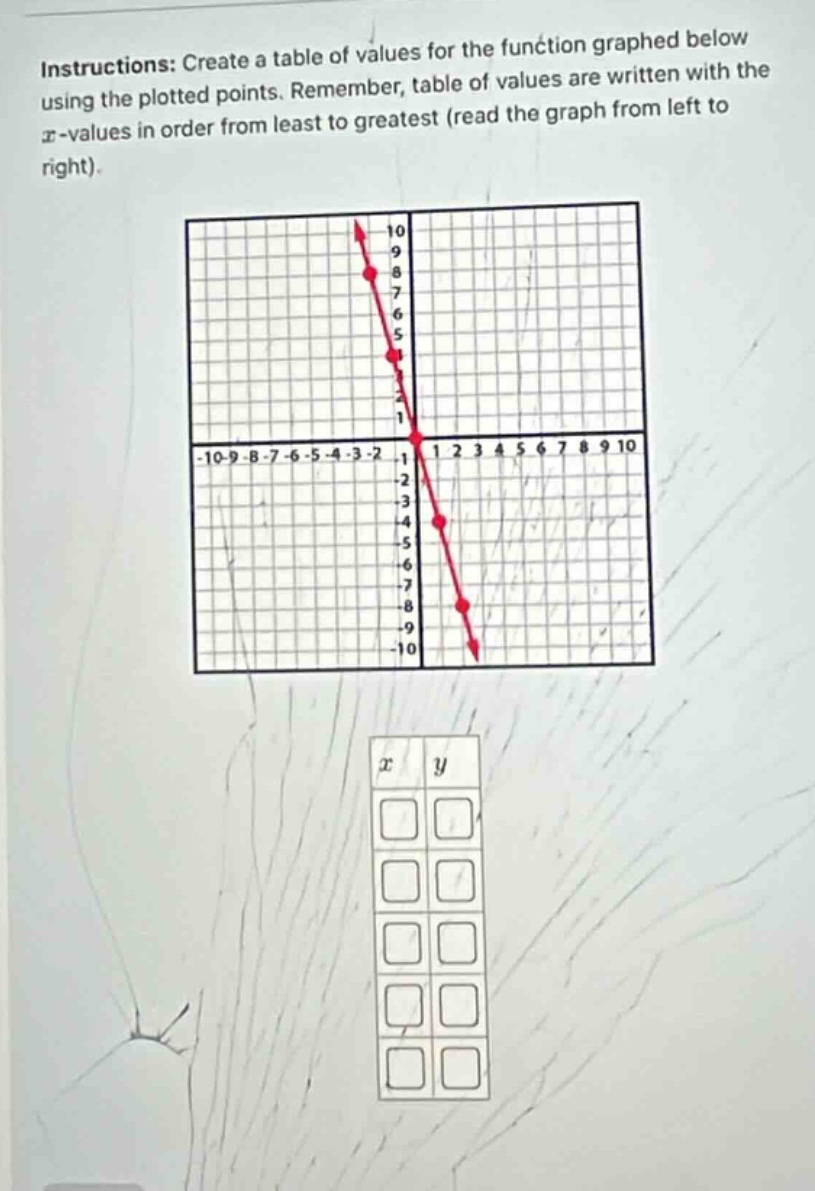
instructions: create a table of values for the function graphed below using the plotted points. remember, table of values are written with the x - values in order from least to greatest (read the graph from left to right).
Answer
Explanation:
Step1: Identify left - most point
The left - most point has $x=-2,y = 8$.
Step2: Identify second point
The next point has $x = 0,y = 4$.
Step3: Identify third point
The third point has $x=2,y = 0$.
Step4: Identify fourth point
The fourth point has $x = 4,y=-4$.
Step5: Identify fifth point
The fifth point has $x=6,y=-8$.
Answer:
| $x$ | $y$ |
|---|---|
| -2 | 8 |
| 0 | 4 |
| 2 | 0 |
| 4 | -4 |
| 6 | -8 |