jeremy rides a ferris wheel. the graph shows h, jeremys height above the ground at any time during the ride…
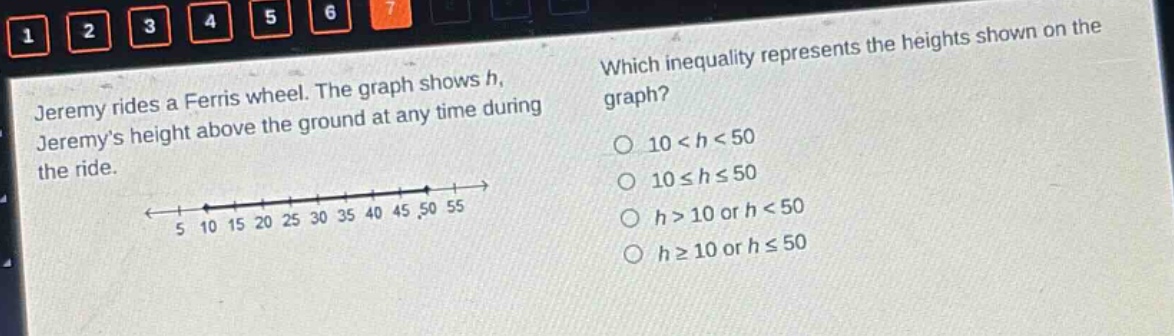
jeremy rides a ferris wheel. the graph shows h, jeremys height above the ground at any time during the ride. which inequality represents the heights shown on the graph? 10 < h < 50 10 ≤ h ≤ 50 h > 10 or h < 50 h ≥ 10 or h ≤ 50
Answer
Answer:
B. $10\leq h\leq50$
Explanation:
Step1: Analyze the graph endpoints
The graph has solid - filled circles at 10 and 50.
Step2: Determine the inequality type
Solid - filled circles mean the values 10 and 50 are included in the range. So the inequality is $10\leq h\leq50$.