jill is washing dishes. she fills the sink with warm water. after a while, the water cools down, so she…
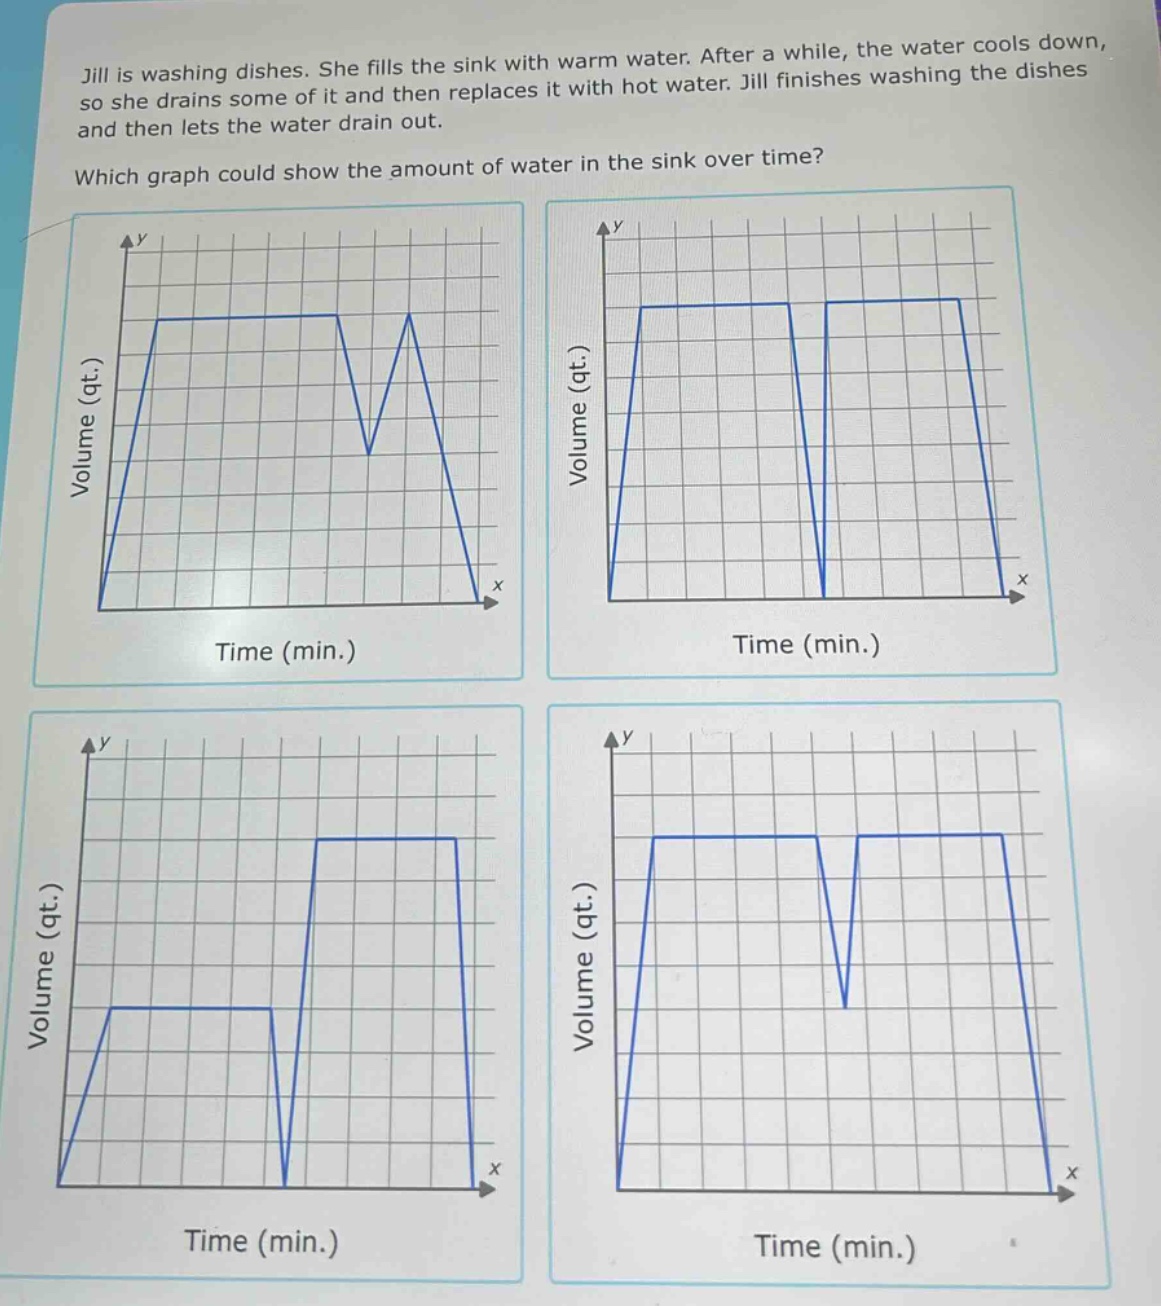
jill is washing dishes. she fills the sink with warm water. after a while, the water cools down, so she drains some of it and then replaces it with hot water. jill finishes washing the dishes and then lets the water drain out. which graph could show the amount of water in the sink over time?
Answer
Explanation:
Step1: Analyze filling - stage
When Jill fills the sink with warm water, the volume of water in the sink increases linearly with time, so the graph has a positive - slope line going up.
Step2: Analyze first - draining and refilling stage
After the water cools down, she drains some water. So the volume of water decreases, giving a negative - slope line. Then she replaces it with hot water, so the volume of water increases again, giving a positive - slope line.
Step3: Analyze final - draining stage
After she finishes washing the dishes, she lets the water drain out. The volume of water decreases to zero, giving a negative - slope line until it reaches the x - axis.
Answer:
The first graph (top - left) could show the amount of water in the sink over time.