juan spent 10 minutes on his history homework and 3 minutes per question on his math homework. which graph…
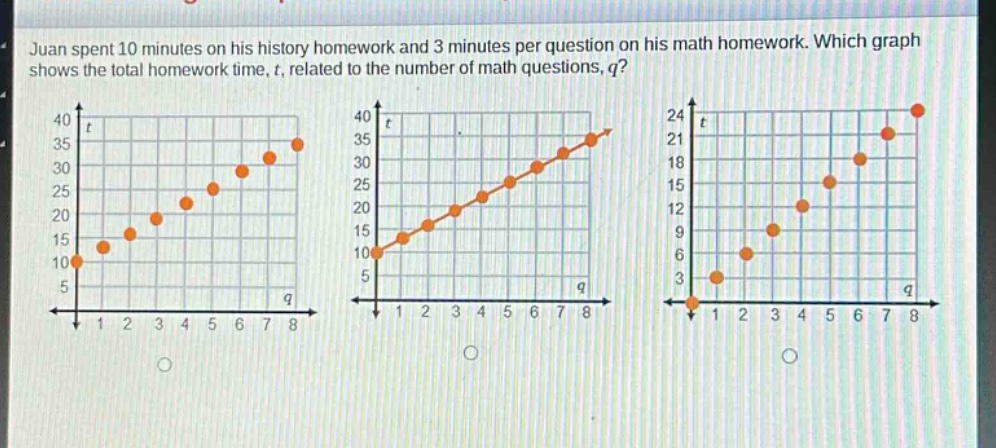
juan spent 10 minutes on his history homework and 3 minutes per question on his math homework. which graph shows the total homework time, t, related to the number of math questions, q?
Answer
Answer:
The second graph.
Explanation:
Step1: Establish the linear - equation
The total homework time $t$ is the sum of the time spent on history homework and the time spent on math homework. Juan spent 10 minutes on history homework and 3 minutes per math question $q$. So the equation is $t = 3q+10$.
Step2: Analyze the y - intercept
When $q = 0$ (no math questions), $t=3\times0 + 10=10$. The y - intercept of the graph (the value of $t$ when $q = 0$) should be 10. All three graphs have a y - intercept of 10.
Step3: Analyze the slope
The slope of the line is the rate of change of $t$ with respect to $q$. Since it takes 3 minutes per math question, the slope $m = 3$. This means for each increase of 1 in $q$, $t$ increases by 3. In the first graph, the points do not follow a slope of 3. In the second graph, as $q$ increases by 1 (from 0 to 1, 1 to 2, etc.), $t$ increases by 3 (from 10 to 13, 13 to 16, etc.). In the third graph, the points do not follow a slope of 3. So the second graph shows the relationship $t = 3q + 10$.