a leaf hangs from a branch 12 feet in the air. it falls to the ground at a rate of 0.25 feet per second…
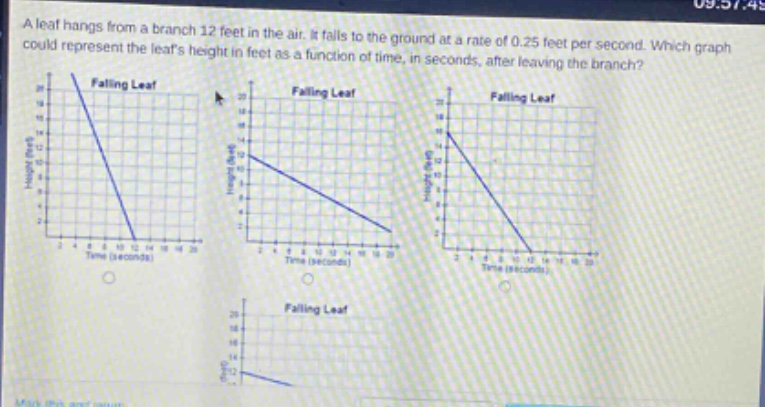
a leaf hangs from a branch 12 feet in the air. it falls to the ground at a rate of 0.25 feet per second. which graph could represent the leafs height in feet as a function of time, in seconds, after leaving the branch?
Answer
Explanation:
Step1: Determine the initial - height
The leaf starts at a height of 12 feet. So when time $t = 0$, the height $h=12$.
Step2: Determine the rate of change
The leaf falls at a rate of 0.25 feet per second. The height $h$ as a function of time $t$ is given by the linear equation $h(t)=12 - 0.25t$. This is a linear function with a slope of - 0.25 (negative because the height is decreasing) and a $y$ - intercept of 12.
Step3: Analyze the end - point
When the leaf hits the ground, $h = 0$. We set $h(t)=0$: [ \begin{align*} 12-0.25t&=0\ 0.25t&=12\ t&=\frac{12}{0.25}=48 \end{align*} ] The graph should start at the point $(0,12)$ and end at the point $(48,0)$ with a straight - line segment connecting them.
Answer:
The graph that starts at the point $(0,12)$ on the height - axis and has a negative slope and ends at the point $(48,0)$ (where the $x$ - axis is time in seconds and the $y$ - axis is height in feet). Without seeing the exact options clearly from the image, the correct graph will be a straight - line starting at $y = 12$ when $x = 0$ and decreasing at a constant rate until it reaches $y = 0$ at $x = 48$.