which would most likely be graphed using a continuous graph? check all that apply. total cost, c, of buying…
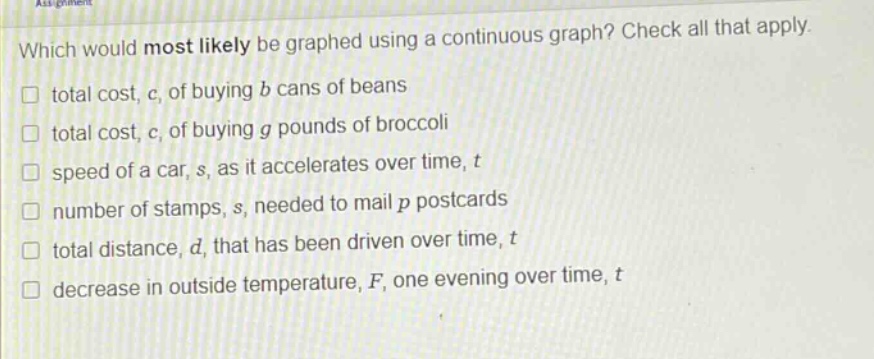
which would most likely be graphed using a continuous graph? check all that apply. total cost, c, of buying b cans of beans total cost, c, of buying g pounds of broccoli speed of a car, s, as it accelerates over time, t number of stamps, s, needed to mail p postcards total distance, d, that has been driven over time, t decrease in outside temperature, f, one evening over time, t
Answer
Brief Explanations:
- For the total cost $c$ of buying $b$ cans of beans, $b$ is a discrete variable (you can't buy a fraction of a can), so it's not continuous.
- For the total cost $c$ of buying $g$ pounds of broccoli, $g$ can take on any non - negative real value (you can buy 1.5 pounds etc.), so it's continuous.
- The speed $s$ of a car as it accelerates over time $t$ can take on any non - negative real value at any given time $t$, so it's continuous.
- The number of stamps $s$ needed to mail $p$ postcards is a discrete variable (you can't have a fraction of a stamp), so it's not continuous.
- The total distance $d$ that has been driven over time $t$ can take on any non - negative real value as time progresses, so it's continuous.
- The decrease in outside temperature $F$ one evening over time $t$ can take on any real value within a range as time passes, so it's continuous.
Answer:
total cost, $c$, of buying $g$ pounds of broccoli speed of a car, $s$, as it accelerates over time, $t$ total distance, $d$, that has been driven over time, $t$ decrease in outside temperature, $F$, one evening over time, $t$