which linear inequality is represented by the graph?\n○ y>2x + 2\n○ y≥1/2x + 1\n○ y>2x + 1\n○ y≥1/2x + 2
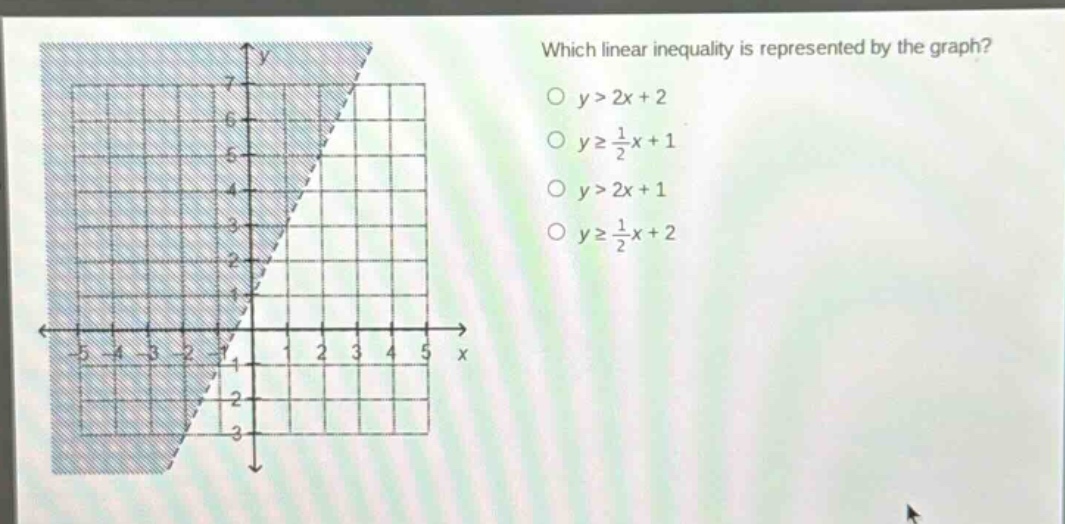
which linear inequality is represented by the graph?\n○ y>2x + 2\n○ y≥1/2x + 1\n○ y>2x + 1\n○ y≥1/2x + 2
Answer
Answer:
C. $y>2x + 1$
Explanation:
Step1: Find the slope and y - intercept of the boundary line
The boundary line passes through points $(0,1)$ and $(1,3)$. The slope $m=\frac{y_2 - y_1}{x_2 - x_1}=\frac{3 - 1}{1 - 0}=2$, and the y - intercept $b = 1$. So the equation of the boundary line is $y=2x + 1$.
Step2: Determine the inequality sign
The boundary line is dashed, so the inequality is either $y>2x + 1$ or $y<2x + 1$. We can test a point in the shaded region, say $(0,2)$. Substitute $x = 0$ and $y = 2$ into the inequalities. For $y>2x + 1$, when $x = 0$, $2>2\times0+1$ (true). So the linear inequality is $y>2x + 1$.