lola bought x pencils that cost $0.25 each and y erasers that cost $0.50. she spent less than $3. which…
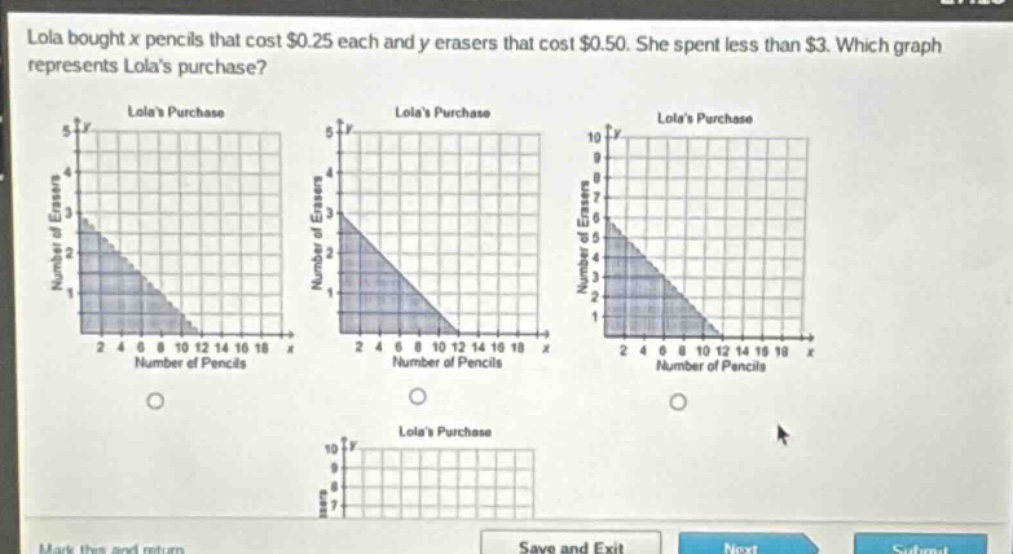
lola bought x pencils that cost $0.25 each and y erasers that cost $0.50. she spent less than $3. which graph represents lolas purchase?
Answer
Explanation:
Step1: Set up the inequality
The cost of pencils is $0.25x$ and the cost of erasers is $0.5y$. Since she spent less than $3$, the inequality is $0.25x + 0.5y<3$.
Step2: Rewrite the inequality in slope - intercept form
Multiply through by 4 to clear the decimals: $x + 2y<12$, which can be rewritten as $y<-\frac{1}{2}x + 6$. The boundary line $y =-\frac{1}{2}x + 6$ has a y - intercept of 6 and a slope of $-\frac{1}{2}$. Also, since the inequality is $y<-\frac{1}{2}x + 6$, the line is dashed and the shading is below the line. When $x = 0$, $y<6$ and when $y = 0$, $x<12$.
Answer:
The graph with a dashed line having a y - intercept of 6 and a slope of $-\frac{1}{2}$ and shading below the line. Without specific labels for the graphs, it's not possible to pick a specific letter - labeled option, but the described graph is the correct one.