what is the lowest value of the range of the function shown on the graph? -∞ -2 0 3
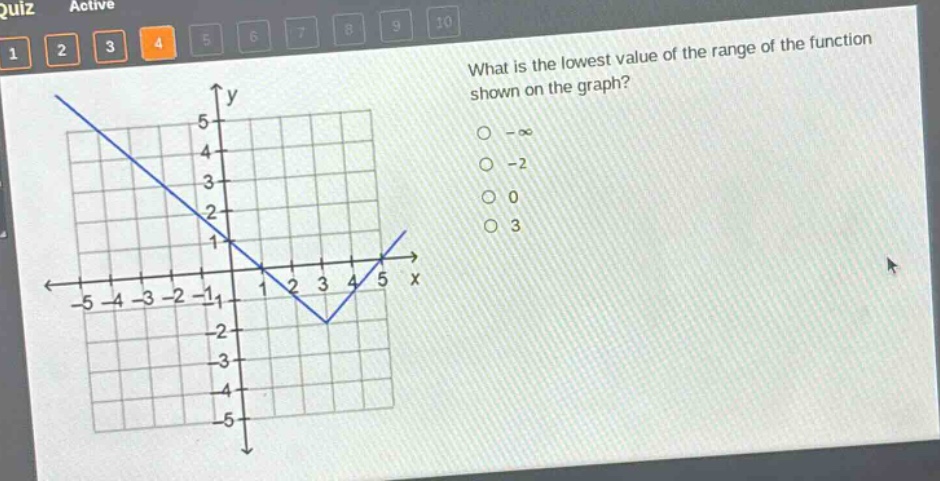
what is the lowest value of the range of the function shown on the graph? -∞ -2 0 3
Answer
Explanation:
Step1: Understand range concept
The range of a function is the set of all possible output values (y - values).
Step2: Identify lowest y - value
By looking at the graph, we find the lowest point on the graph in the y - direction. The lowest point of the function graph has a y - coordinate of - 2.
Answer:
- 2