a machine at a bakery is pouring out flour. the graph shows the amount of flour (in grams) in the machine…
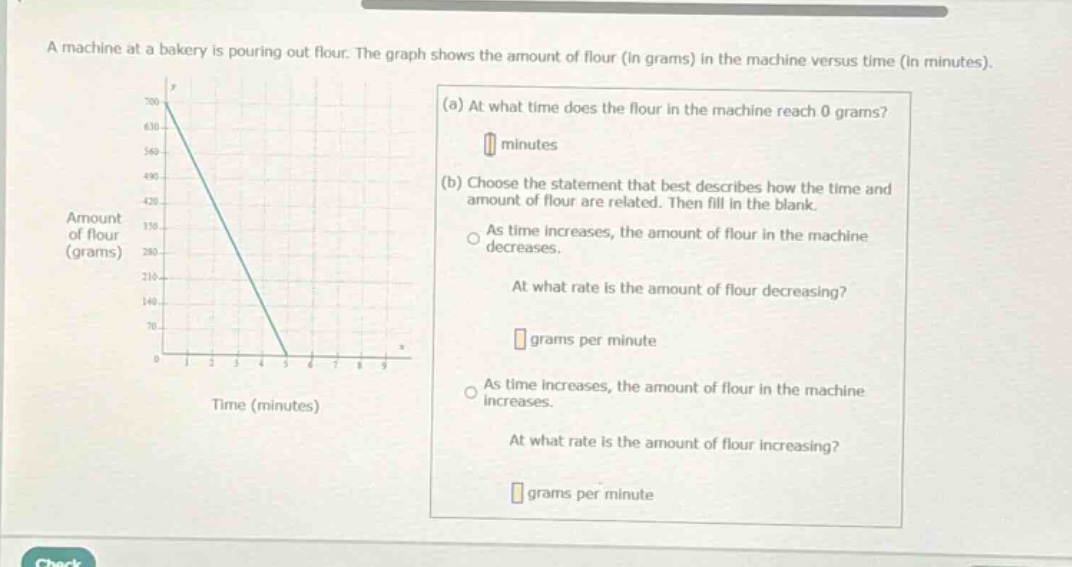
a machine at a bakery is pouring out flour. the graph shows the amount of flour (in grams) in the machine versus time (in minutes). (a) at what time does the flour in the machine reach 0 grams? minutes (b) choose the statement that best describes how the time and amount of flour are related. then fill in the blank. as time increases, the amount of flour in the machine decreases. at what rate is the amount of flour decreasing? grams per minute as time increases, the amount of flour in the machine increases. at what rate is the amount of flour increasing? grams per minute
Answer
Answer:
(a) 5 (b) As time increases, the amount of flour in the machine decreases. 140
Explanation:
Step1: Find x - intercept
The graph intersects x - axis (y = 0) at x = 5. So the flour reaches 0 grams at 5 minutes.
Step2: Determine slope
The line passes through (0,700) and (5,0). The slope formula is $m=\frac{y_2 - y_1}{x_2 - x_1}$. Here, $x_1 = 0,y_1=700,x_2 = 5,y_2 = 0$. Then $m=\frac{0 - 700}{5-0}=\frac{-700}{5}=- 140$. The negative slope means the amount of flour is decreasing at a rate of 140 grams per minute.