a manufacturing machine has two processes. one of them is repeated 4 times and the second only once. the…
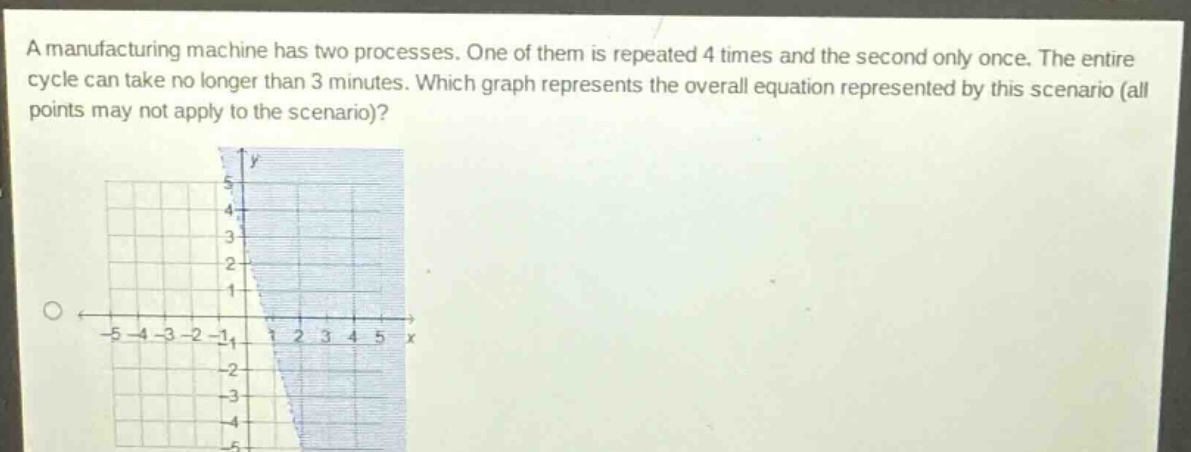
a manufacturing machine has two processes. one of them is repeated 4 times and the second only once. the entire cycle can take no longer than 3 minutes. which graph represents the overall equation represented by this scenario (all points may not apply to the scenario)?
Answer
Answer:
We first need to set up an equation for the scenario. Let (x) be the time for the first - process (the one repeated 4 times) and (y) be the time for the second process. The total time for the cycle is (4x + y), and since the entire cycle can take no longer than 3 minutes, the inequality is (4x + y\leq3). We can rewrite it in slope - intercept form (y\leq - 4x+3). The boundary line (y=-4x + 3) has a (y) - intercept of 3 and a slope of (-4). The region below the line (y=-4x + 3) (including the line itself) represents the solution set of the inequality (4x + y\leq3). Without seeing all the graph options, we can analyze the key features of the correct graph: it should have a solid line (because the inequality is (\leq)) with a (y) - intercept of 3 and a slope of (-4), and the shaded region should be below the line.
Explanation:
Step1: Define variables
Let (x) be time of first process, (y) be time of second process.
Step2: Set up inequality
(4x + y\leq3)
Step3: Rewrite in slope - intercept form
(y\leq - 4x+3)
Step4: Analyze graph features
Solid line, (y) - intercept 3, slope (-4), shaded below.