martha is going to ride the ferris wheel at the state fair. she climbs onto a platform that is a few feet…
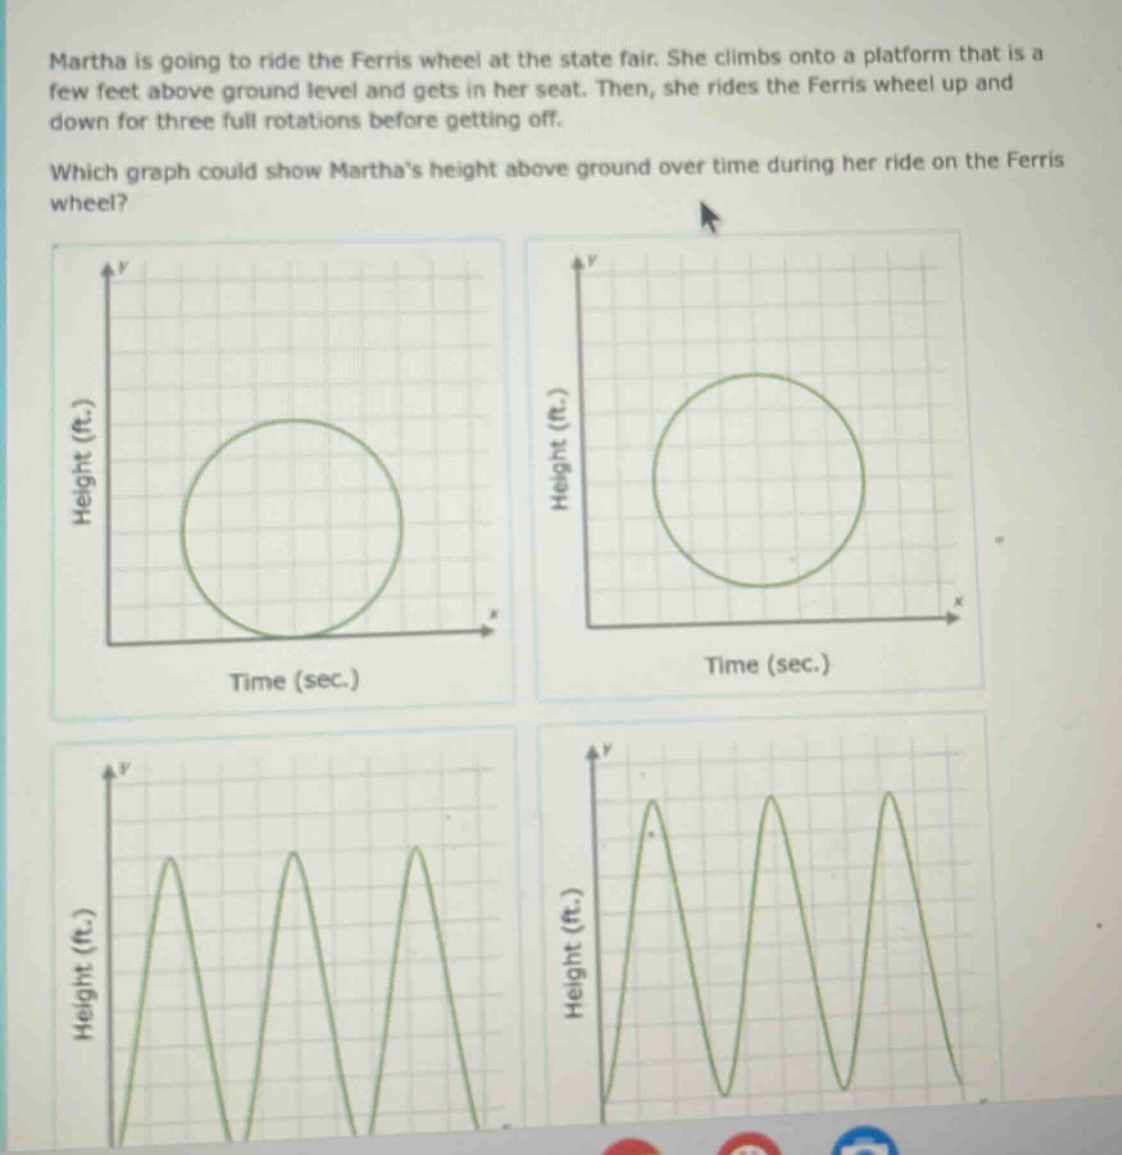
martha is going to ride the ferris wheel at the state fair. she climbs onto a platform that is a few feet above ground level and gets in her seat. then, she rides the ferris wheel up and down for three full rotations before getting off. which graph could show marthas height above ground over time during her ride on the ferris wheel?
Answer
Explanation:
Step1: Understand Ferris - wheel motion
The height of a person on a Ferris - wheel changes periodically. As the Ferris - wheel rotates, the height starts at a non - zero value (since Martha starts on a platform above the ground), goes up to a maximum, comes down to a minimum (but not zero as there is a platform), and repeats this pattern for each rotation.
Step2: Analyze the graphs
The first two graphs are circles which do not represent the height over time correctly as height is a one - dimensional quantity changing with time. The third graph has sharp peaks and valleys which do not accurately represent the smooth up - and - down motion of a Ferris - wheel. The fourth graph shows a smooth, periodic function with a non - zero starting height, going up and down three times, which is consistent with Martha's ride on the Ferris - wheel.
Answer:
The fourth graph (the one with smooth, periodic up - and - down curves for three cycles and a non - zero starting height)