an office supply store offers banner printing services. the store charges $4 to print each one - foot - long…
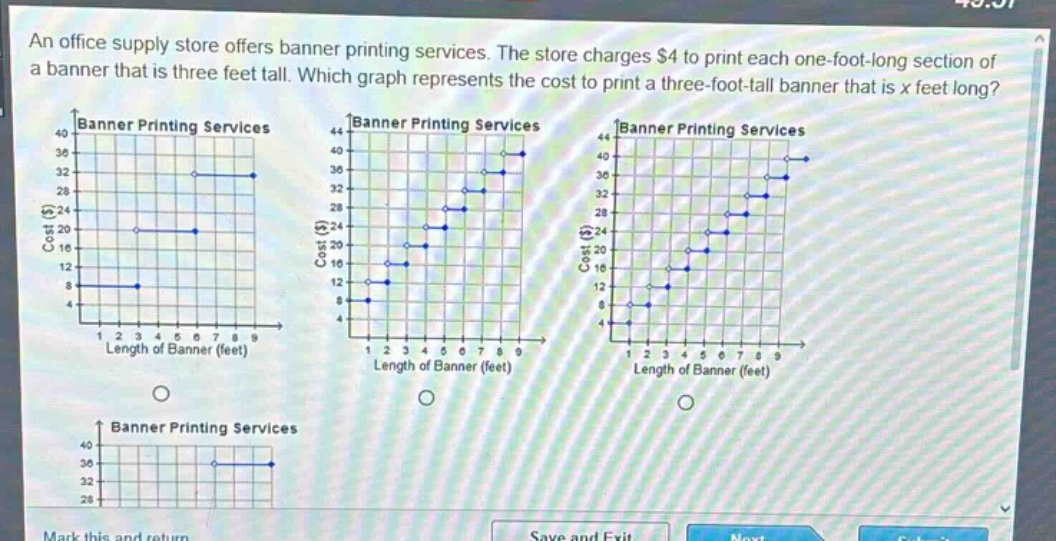
an office supply store offers banner printing services. the store charges $4 to print each one - foot - long section of a banner that is three feet tall. which graph represents the cost to print a three - foot - tall banner that is x feet long?
Answer
Explanation:
Step1: Determine cost - length relationship
The cost $C$ to print a banner of length $x$ feet, with a charge of $4$ dollars per foot - long section, is given by the equation $C = 4x$. This is a linear relationship with a slope of $4$ and a $y$ - intercept of $0$. When $x = 1$, $C=4\times1 = 4$; when $x = 2$, $C = 4\times2=8$; when $x = 3$, $C = 4\times3 = 12$, and so on.
Step2: Analyze the graphs
We are looking for a graph where the points follow the pattern of the cost increasing by $4$ for each unit increase in the length of the banner. The points should be $(1,4),(2,8),(3,12),\cdots$. The graph should be a set of discrete points (since the length of the banner is likely sold in whole - foot increments) and should have a positive slope.
Answer:
The graph with points $(1,4),(2,8),(3,12),\cdots$ (the graph where the cost increases by $4$ for each one - unit increase in the length of the banner) represents the cost to print the banner. Without specific labels for each graph, it's not possible to identify it by name, but it's the graph that shows a linear increase with a slope of $4$ for discrete values of the length of the banner.