one company estimates same - day delivery as more than three less than half the total number of miles. which…
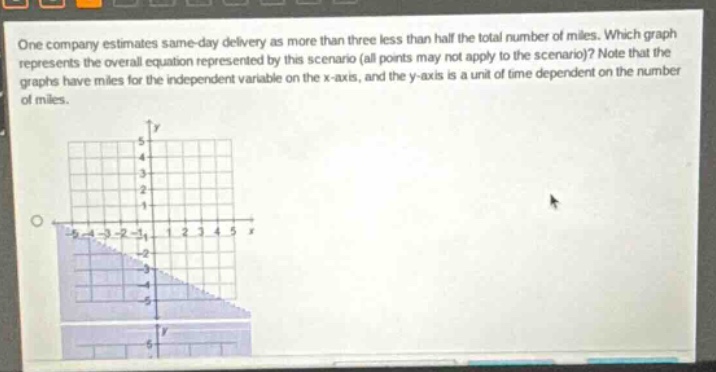
one company estimates same - day delivery as more than three less than half the total number of miles. which graph represents the overall equation represented by this scenario (all points may not apply to the scenario)? note that the graphs have miles for the independent variable on the x - axis, and the y - axis is a unit of time dependent on the number of miles.
Answer
- First, translate the verbal - description into an inequality:
- Let (x) be the number of miles and (y) be the time for same - day delivery.
- The statement “same - day delivery as more than three less than half the total number of miles” can be written as (y>\frac{1}{2}x - 3).
- Analyze the boundary line of the inequality:
- The boundary line of the inequality (y>\frac{1}{2}x - 3) is the equation (y = \frac{1}{2}x - 3).
- The slope of the line (y=\frac{1}{2}x - 3) is (m=\frac{1}{2}), and the (y) - intercept is (b=-3).
- Since the inequality is (y>\frac{1}{2}x - 3) (a strict inequality, “greater than”), the boundary line is a dashed line.
- Test a point to determine which side of the line to shade:
- A common point to test is the origin ((0,0)).
- Substitute (x = 0) and (y = 0) into the inequality (y>\frac{1}{2}x - 3).
- We get (0>\frac{1}{2}(0)-3), which simplifies to (0>-3). This is a true statement. So, we shade the side of the line that contains the origin.
Explanation:
Step1: Translate to inequality
Let (x) be miles and (y) be time. The inequality is (y>\frac{1}{2}x - 3).
Step2: Identify boundary - line
The boundary line is (y=\frac{1}{2}x - 3), slope (\frac{1}{2}), (y) - intercept (-3), and it's dashed for (>).
Step3: Test a point
Test ((0,0)): (0>\frac{1}{2}(0)-3) is true, so shade side with origin.
The graph with a dashed line (y = \frac{1}{2}x - 3) and the region above the line (including the region that contains the origin) is the correct graph. Since no other graphs are shown in the problem - statement, the steps above describe how to identify the correct graph. If there were multiple graphs to choose from, we would look for a graph with a dashed line having a slope of (\frac{1}{2}), (y) - intercept of (-3), and the region above the line shaded.