owners of a recreation area are adding water to a pond. the graph below shows the amount of water in the…
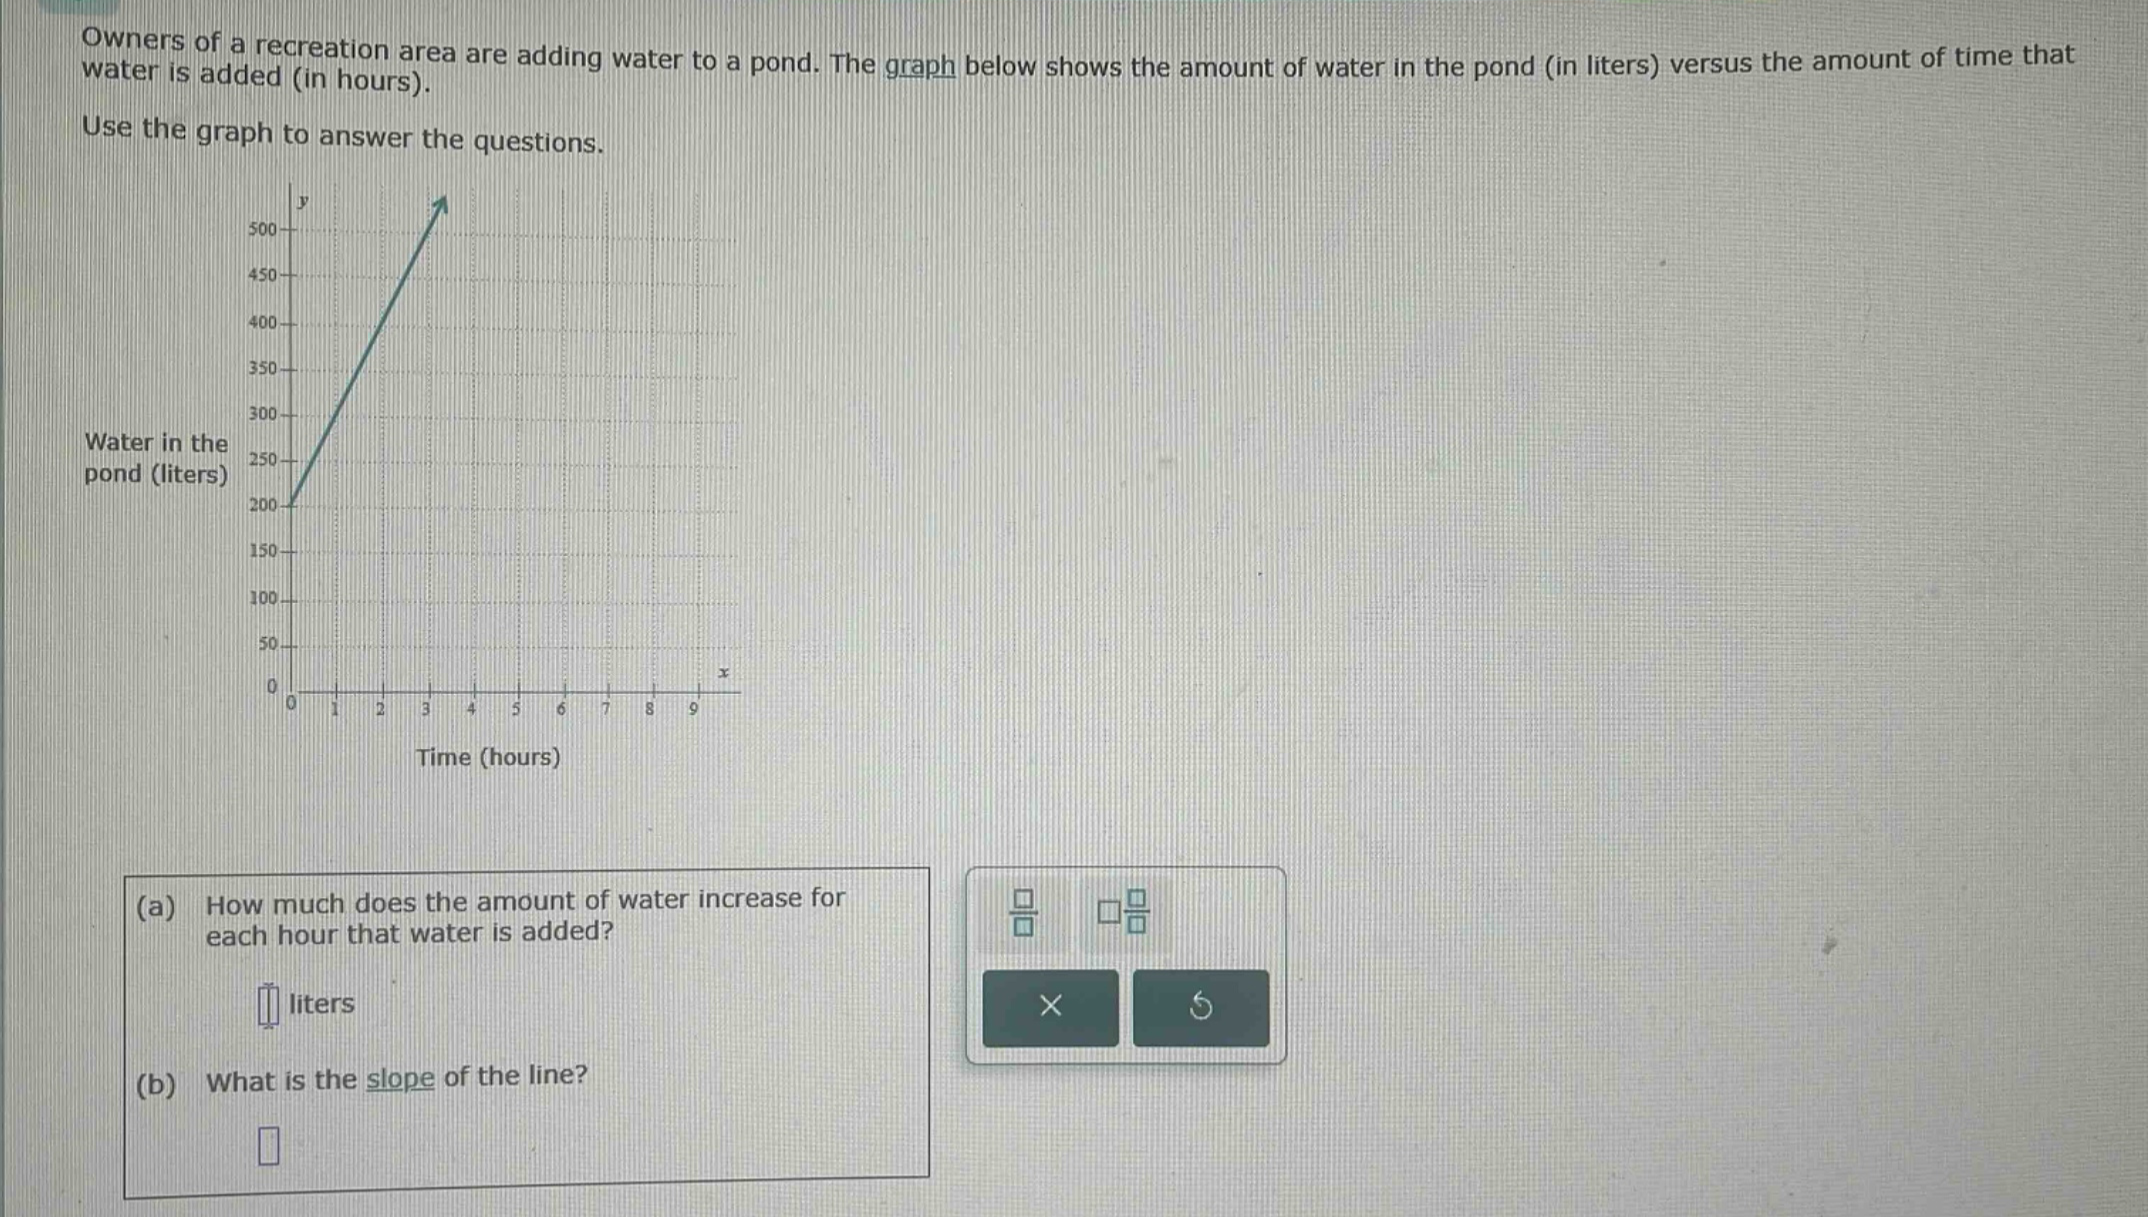
owners of a recreation area are adding water to a pond. the graph below shows the amount of water in the pond (in liters) versus the amount of time that water is added (in hours). use the graph to answer the questions. (a) how much does the amount of water increase for each hour that water is added? liters (b) what is the slope of the line?
Answer
Explanation:
Step1: Select two points on the line
Let's take two points $(0, 200)$ and $(2,300)$.
Step2: Calculate the rate of change (increase per hour)
The increase in water is $\frac{300 - 200}{2-0}=\frac{100}{2}=50$ liters per hour.
Step3: Recall the concept of slope
The slope of a line representing a linear - relationship between two variables (here water amount and time) is the same as the rate of change. So the slope $m = 50$.
Answer:
(a) 50 liters (b) 50