when planning for a party, one caterer recommends the amount of meat be 2 pounds fewer than $\frac{1}{3}$…
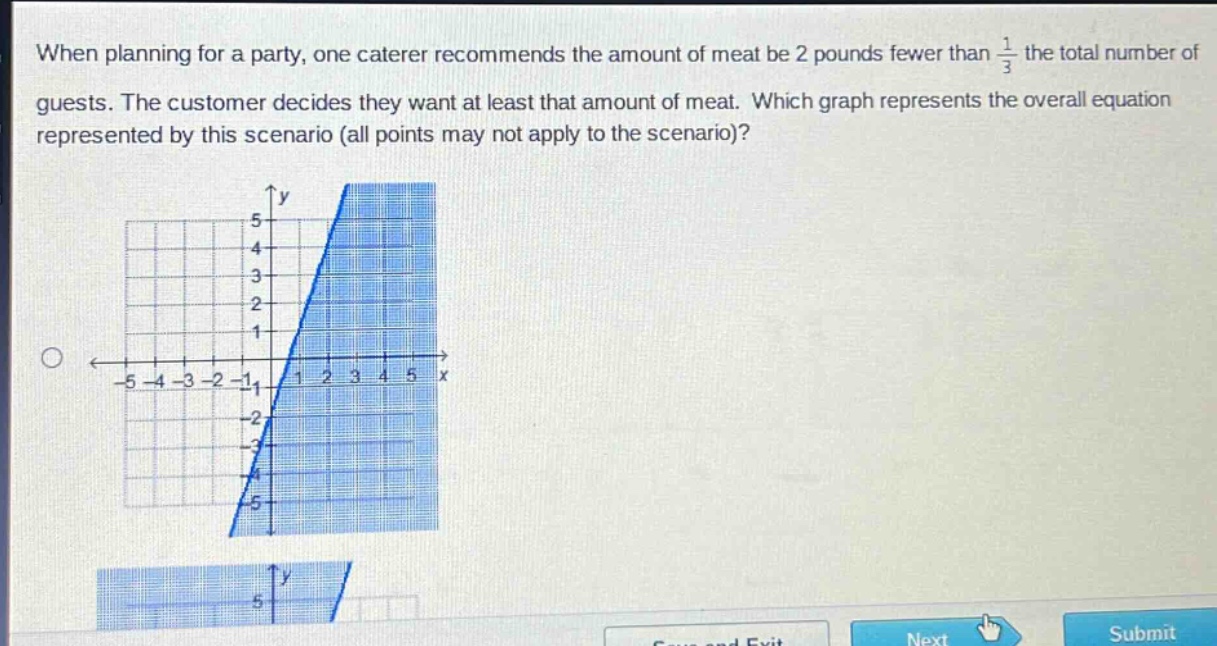
when planning for a party, one caterer recommends the amount of meat be 2 pounds fewer than $\frac{1}{3}$ the total number of guests. the customer decides they want at least that amount of meat. which graph represents the overall equation represented by this scenario (all points may not apply to the scenario)?
Answer
Explanation:
Step1: Define variables
Let $x$ be the total number of guests and $y$ be the amount of meat. The caterer's recommendation is $y=\frac{1}{3}x - 2$. The customer wants at least that amount of meat, so the inequality is $y\geq\frac{1}{3}x - 2$.
Step2: Analyze the boundary - line
The boundary - line of the inequality $y\geq\frac{1}{3}x - 2$ is the equation $y = \frac{1}{3}x - 2$. The slope of the line is $\frac{1}{3}$ and the y - intercept is - 2.
Step3: Determine the shading
Since the inequality is $y\geq\frac{1}{3}x - 2$, we shade above the line $y=\frac{1}{3}x - 2$.
Answer:
The graph with a solid line $y=\frac{1}{3}x - 2$ (because the inequality is $\geq$) and the region above the line shaded. Without seeing all the options completely, based on the description in the steps, the graph that has a line with a positive slope of $\frac{1}{3}$, crosses the y - axis at - 2 and has the area above the line shaded is the correct one.