practice applying the slope - intercept form of an equation. which graph represents the function y =…
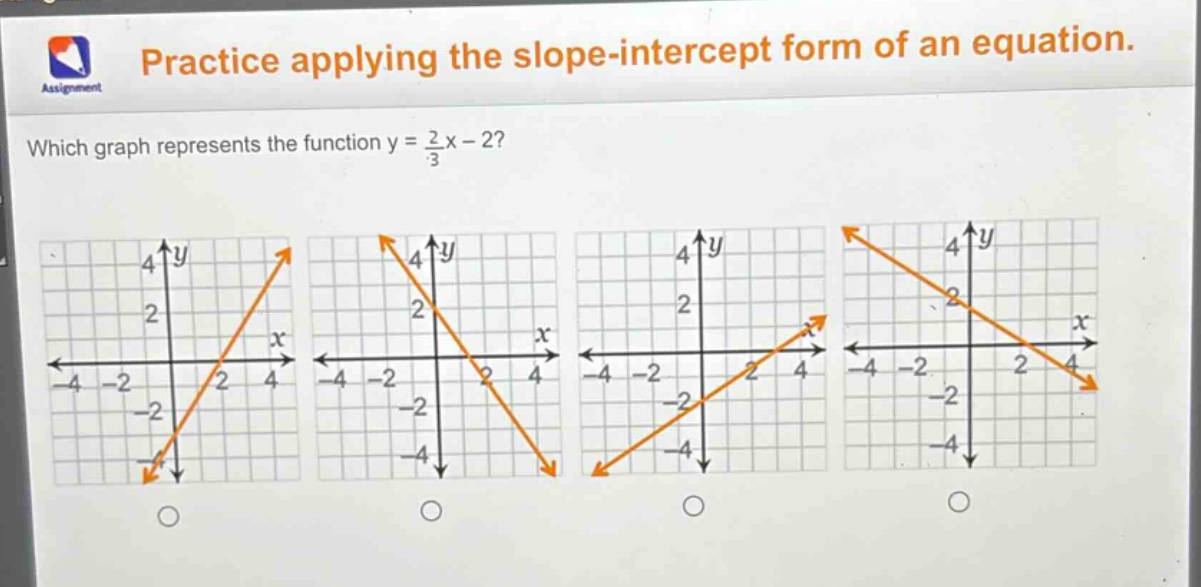
practice applying the slope - intercept form of an equation. which graph represents the function y = $\frac{2}{3}$x - 2?
Answer
Answer:
The third graph.
Explanation:
Step1: Identify slope and y - intercept
The slope - intercept form is $y = mx + b$, where $m$ is the slope and $b$ is the y - intercept. For $y=\frac{2}{3}x - 2$, $m=\frac{2}{3}$ (positive slope) and $b=-2$.
Step2: Analyze positive slope
A positive slope means the line rises from left to right. Eliminate graphs with negative - sloped lines.
Step3: Check y - intercept
The y - intercept is $-2$, so the line crosses the y - axis at the point $(0, - 2)$. The third graph has a positive slope and crosses the y - axis at $(0,-2)$.