ramon is graphing the function f(x) = 3(4)^x. he begins by plotting the initial value. which graph…
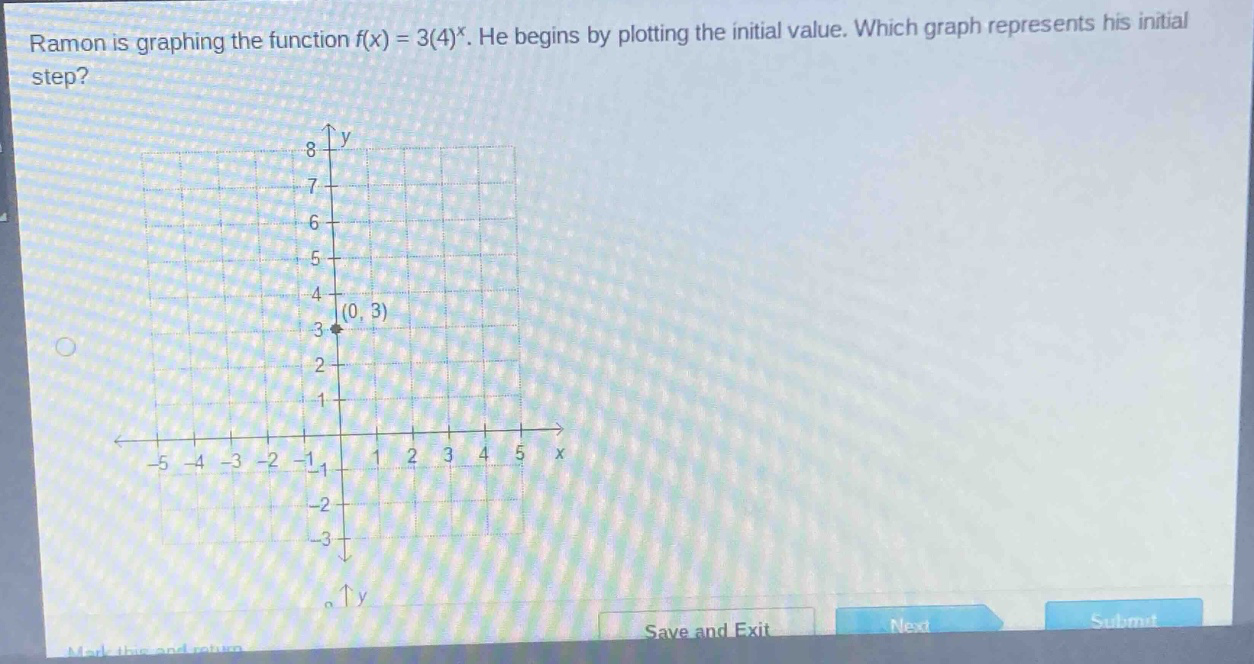
ramon is graphing the function f(x) = 3(4)^x. he begins by plotting the initial value. which graph represents his initial step?
Answer
Explanation:
Step1: Recall initial - value formula for exponential function
For an exponential function of the form $y = a(b)^x$, the initial value is found when $x = 0$.
Step2: Substitute $x = 0$ into the function
Given $f(x)=3(4)^x$, when $x = 0$, we have $f(0)=3(4)^0$. Since any non - zero number to the power of 0 is 1, $4^0 = 1$. So $f(0)=3\times1=3$. The point to be plotted is $(0,3)$.
Answer:
The graph with the point $(0,3)$ plotted (the one shown in the image where the point $(0,3)$ is marked on the y - axis) represents his initial step.