what is the rate of change seen in the graph below?
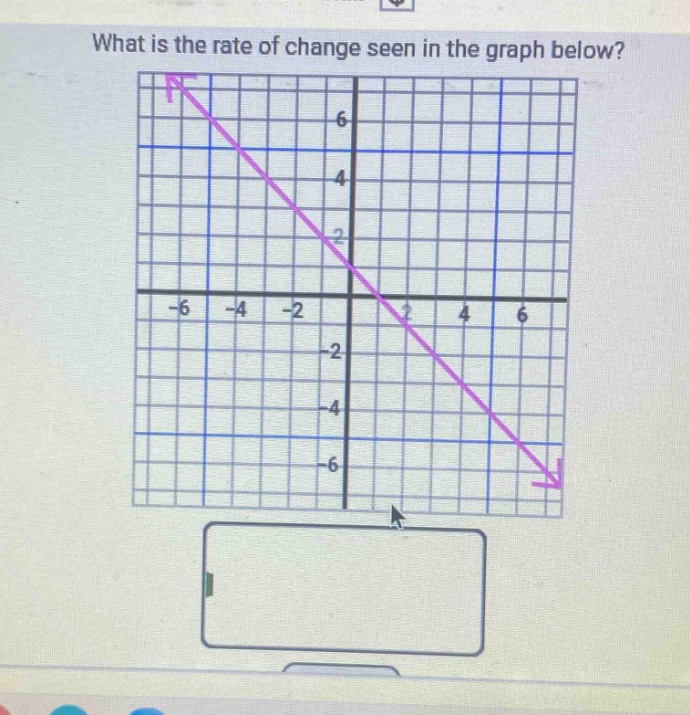
what is the rate of change seen in the graph below?
Answer
Explanation:
Step1: Select two points on the line
Let's take the points (-6, 6) and (6, -6).
Step2: Use the slope - formula
The slope formula is $m=\frac{y_2 - y_1}{x_2 - x_1}$. Here, $x_1=-6,y_1 = 6,x_2=6,y_2=-6$. Then $m=\frac{-6 - 6}{6-(-6)}$.
Step3: Simplify the expression
$m=\frac{-12}{12}=-1$.
Answer:
-1