recognizing exponential decay\nwhich graph represents exponential decay?
recognizing exponential decay\nwhich graph represents exponential decay?
Answer
Explanation:
Step1: Recall exponential - decay property
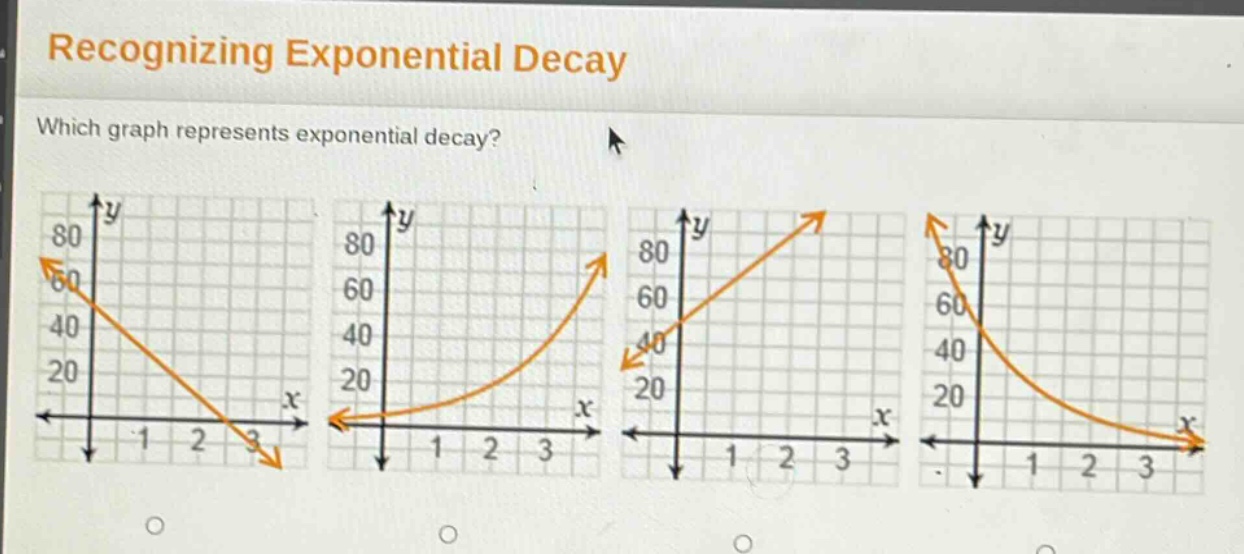
An exponential - decay function has the form $y = a\cdot b^{x}$, where $a>0$ and $0 < b<1$. Its graph starts at a positive $y$ - intercept and decreases as $x$ increases, getting closer and closer to the $x$ - axis but never reaching it.
Step2: Analyze each graph
The first graph is a linear function. The second and third graphs are increasing functions (exponential growth). The fourth graph starts at a positive $y$ - value and decreases as $x$ increases, approaching the $x$ - axis, which is characteristic of exponential decay.
Answer:
The fourth graph (from the left)