representing a scenario with a two - variable linear inequality\nfelix bought x pounds of grapes that cost…
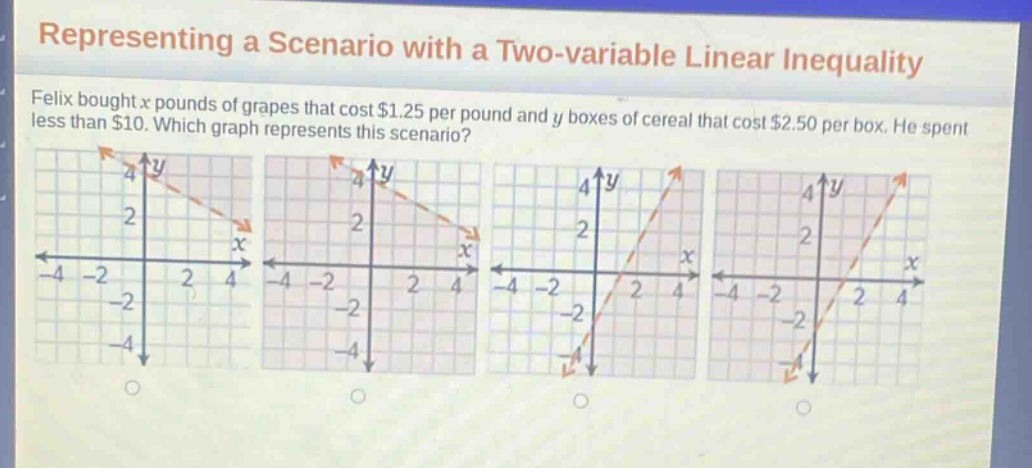
representing a scenario with a two - variable linear inequality\nfelix bought x pounds of grapes that cost $1.25 per pound and y boxes of cereal that cost $2.50 per box. he spent less than $10. which graph represents this scenario?
Answer
Explanation:
Step1: Write the inequality
The cost of grapes is $1.25x$ and the cost of cereal is $2.5y$. Since he spent less than $10$, the inequality is $1.25x + 2.5y<10$.
Step2: Rewrite in slope - intercept form
Divide the entire inequality by $2.5$: $\frac{1.25x}{2.5}+\frac{2.5y}{2.5}<\frac{10}{2.5}$, which simplifies to $0.5x + y<4$ or $y<- 0.5x + 4$. The boundary line is $y=-0.5x + 4$ and it is a dashed line (because the inequality is $<$ not $\leq$), and we shade the region below the line.
Answer:
The graph with a dashed line having a negative slope and shading below the line.