a ride at an amusement park has two options for cars, one that holds 6 passengers and one that holds 3…
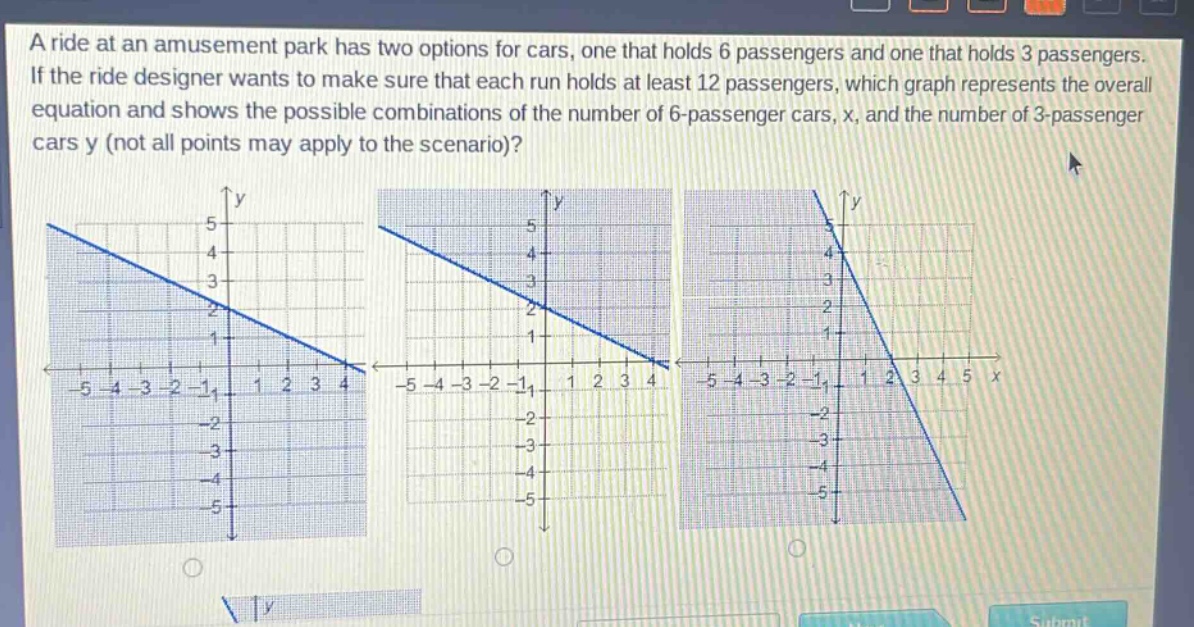
a ride at an amusement park has two options for cars, one that holds 6 passengers and one that holds 3 passengers. if the ride designer wants to make sure that each run holds at least 12 passengers, which graph represents the overall equation and shows the possible combinations of the number of 6 - passenger cars, x, and the number of 3 - passenger cars y (not all points may apply to the scenario)?
Answer
Explanation:
Step1: Form the inequality
The number of passengers in 6 - passenger cars is $6x$ and in 3 - passenger cars is $3y$. Since each run holds at least 12 passengers, the inequality is $6x + 3y\geq12$. Simplify it to $y\geq - 2x+4$.
Step2: Analyze the boundary line
The boundary line of the inequality $y=-2x + 4$ has a y - intercept of 4 (when $x = 0$, $y=4$) and an x - intercept of 2 (when $y = 0$, $0=-2x + 4$, then $2x=4$, $x = 2$).
Step3: Determine the shading
Since the inequality is $y\geq - 2x+4$, we shade above the line $y=-2x + 4$.
Answer:
The graph with the line $y=-2x + 4$ (a straight - line with y - intercept 4 and x - intercept 2) and the region above the line shaded.