sam is building a square patio out of paving stones for a customer. the customer chose square paving stones…
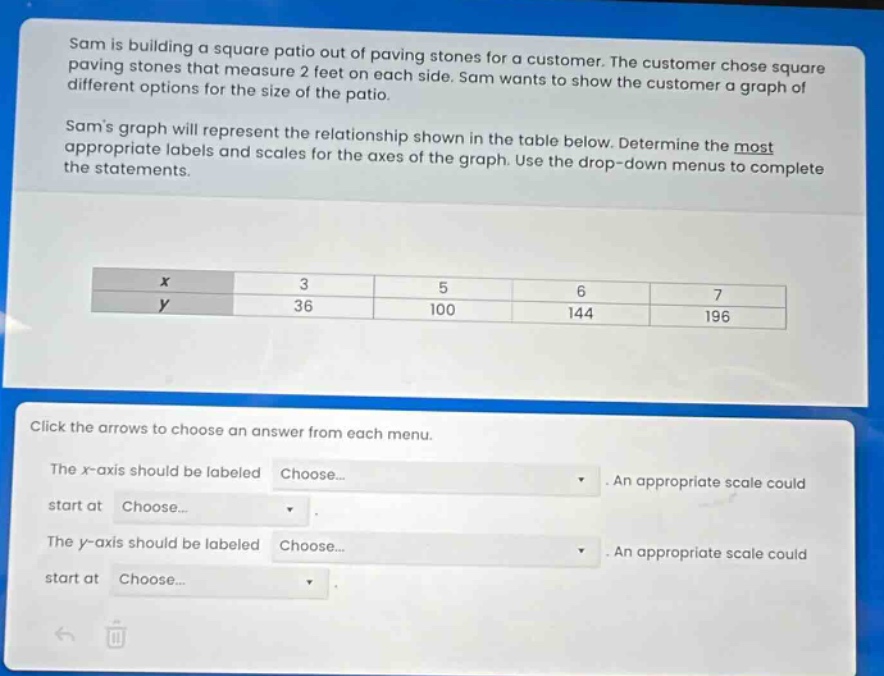
sam is building a square patio out of paving stones for a customer. the customer chose square paving stones that measure 2 feet on each side. sam wants to show the customer a graph of different options for the size of the patio.\nsams graph will represent the relationship shown in the table below. determine the most appropriate labels and scales for the axes of the graph. use the drop - down menus to complete the statements.\n\n| x | 3 | 5 | 6 | 7 |\n| y | 36 | 100 | 144 | 196 |\n\nclick the arrows to choose an answer from each menu.\nthe x - axis should be labeled choose... . an appropriate scale could start at choose... .\nthe y - axis should be labeled choose... . an appropriate scale could start at choose... .
Answer
Explanation:
Step1: Analyze the variables
The $x$ - values likely represent the number of paving - stones along one side of the square patio. The $y$ - values are the areas of the patios. Since the paving stones are 2 feet on each side, if there are $n$ stones along one side, the side - length of the patio $s = 2n$ feet and the area $A=s^{2}=(2n)^{2}=4n^{2}$.
Step2: Determine $x$ - axis label and scale
The $x$ - axis represents the number of paving stones along one side of the square patio. The smallest $x$ - value in the table is 3. So, an appropriate scale for the $x$ - axis could start at 0 (to include the possibility of a patio with no stones, although not in the table) and increase in increments of 1. The label for the $x$ - axis should be "Number of paving stones along one side".
Step3: Determine $y$ - axis label and scale
The $y$ - values are the areas of the patios in square feet. The smallest $y$ - value in the table is 36. An appropriate scale for the $y$ - axis could start at 0 (to include the possibility of a patio with area 0) and increase in increments that are reasonable for the data, such as 20 or 25. The label for the $y$ - axis should be "Area of the patio (square feet)".
Answer:
The $x$-axis should be labeled "Number of paving stones along one side". An appropriate scale could start at 0. The $y$-axis should be labeled "Area of the patio (square feet)". An appropriate scale could start at 0.