on saturday morning, mia biked to her friends house. she stayed there for a few hours, and then biked home…
on saturday morning, mia biked to her friends house. she stayed there for a few hours, and then biked home around lunch time. which graph could show mias distance from her home over time?
Answer
Explanation:
Step1: Analyze Mia's journey
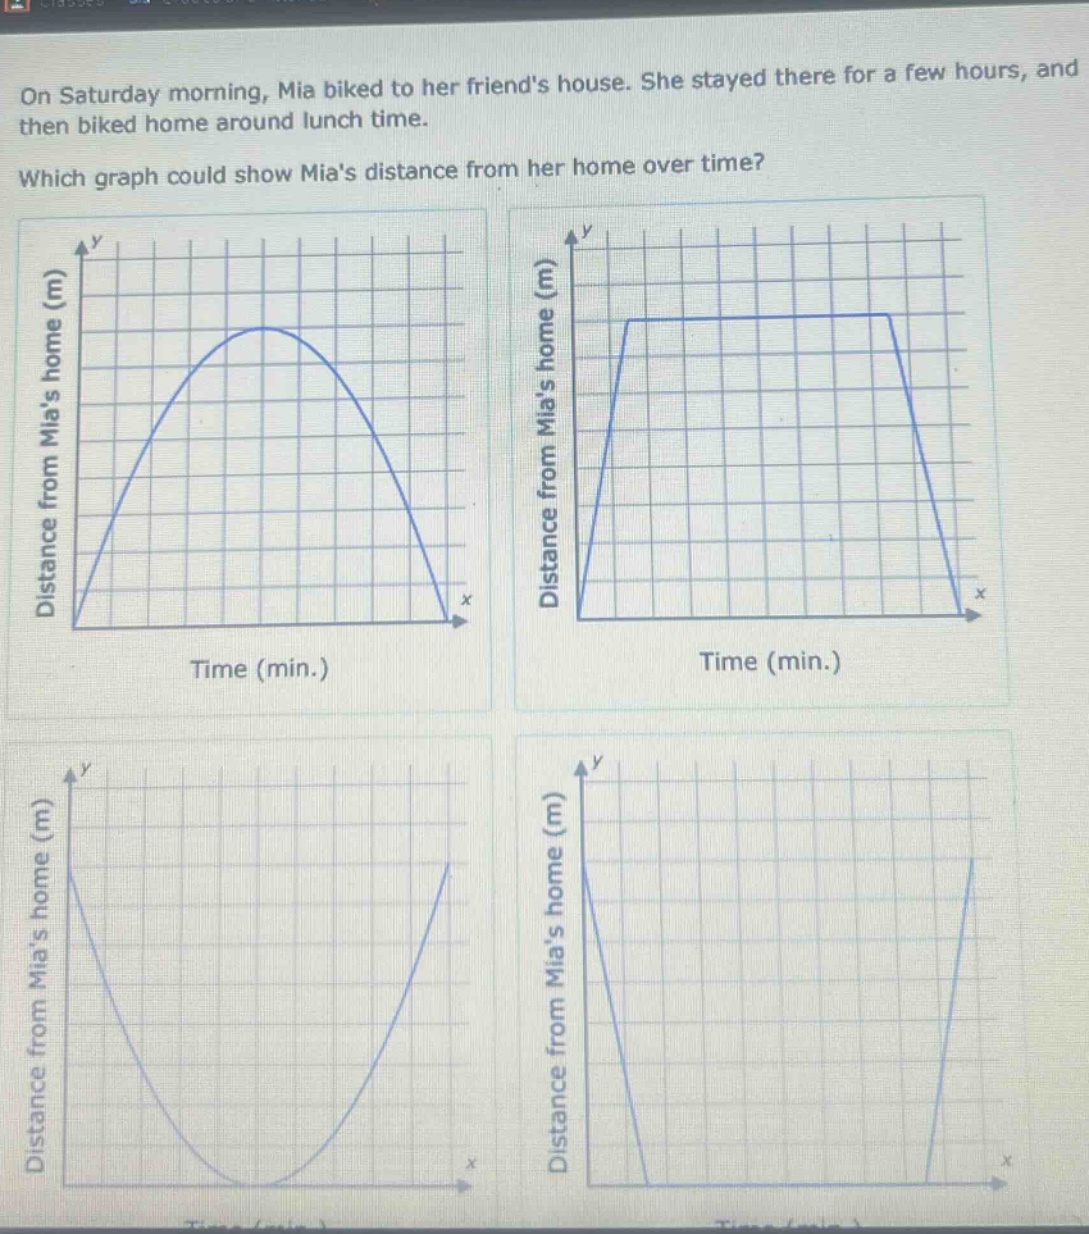
Mia starts at home (distance = 0), bikes to her friend's house (distance increases), stays there for a while (distance remains constant), then bikes back home (distance decreases to 0).
Step2: Match with graphs
The graph with an increasing - constant - decreasing pattern is the correct one. The first graph has a peak - decreasing - increasing which is wrong. The third and fourth graphs have a minimum value other than 0 at some point which is incorrect as she starts and ends at home (distance = 0). The second graph has an initial increase in distance as she bikes to her friend's, a horizontal line while she stays, and then a decrease as she bikes back home.
Answer:
The second graph (the one with an increasing - constant - decreasing pattern as time progresses)