select the correct answer. which graph represents the given exponential function? $f(x)=5(3)^{x}-1$
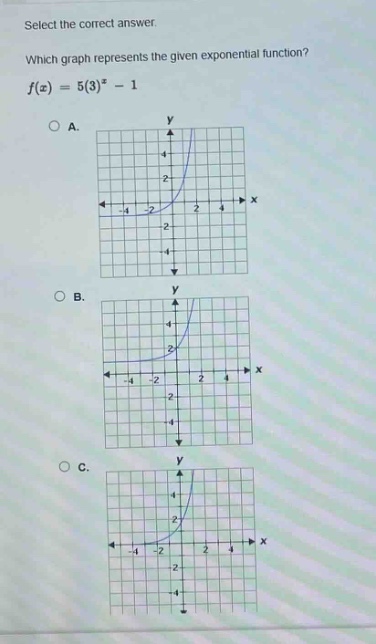
select the correct answer. which graph represents the given exponential function? $f(x)=5(3)^{x}-1$
Answer
Explanation:
Step1: Find the y - intercept
Set (x = 0) in (y=f(x)=5(3)^{x}-1). Then (y=5(3)^{0}-1=5\times1 - 1=4).
Step2: Analyze the horizontal asymptote
For an exponential function of the form (y = a(b)^{x}+k), here (a = 5), (b = 3>1) and (k=-1). The horizontal asymptote is (y = k=-1).
Step3: Check the growth behavior
Since (b = 3>1), the function is an increasing exponential function.
Now let's check the graphs:
- In option A, the y - intercept is around (y = 2) which is incorrect as we found (y - intercept=4).
- In option B, the y - intercept is (y = 4) and the function is increasing with a horizontal asymptote (y=-1).
- In option C, the y - intercept is around (y = 2) which is incorrect.
Answer:
B.